5 V/1 2 V/1 5 V o r Ad ju s t a b le , High-Effic ie nc y,
Low I , Ste p-Up DC-DC Controlle rs
Q
0–MAX73
3.5
3.5
3.0
2.5
VOUT = 5V
L = 22µH
V
= 12V
OUT
L = 22µH
3.0
2.5
2.0
R
SENSE
= 40mΩ
R
SENSE
= 40mΩ
R
= 50mΩ
SENSE
R
SENSE
= 50mΩ
R
SENSE
= 75mΩ
2.0
1.5
1.0
R
= 75mΩ
SENSE
1.5
1.0
R
SENSE
= 100mΩ
R
= 100mΩ
SENSE
0.5
0
0.5
0
R
SENSE
= 200mΩ
R
SENSE
= 200mΩ
2
4
6
8
10
12
2
3
4
5
INPUT VOLTAGE (V)
INPUT VOLTAGE (V)
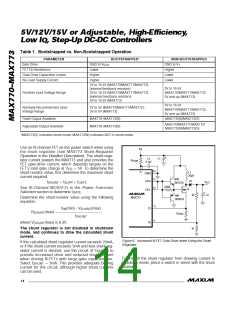
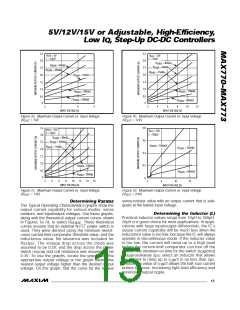
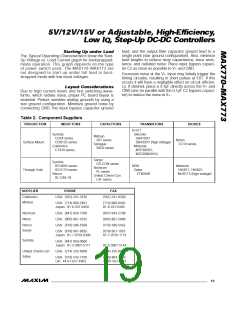
Figure 7a. Maximum Output Current vs. Input Voltage
(V = 5V)
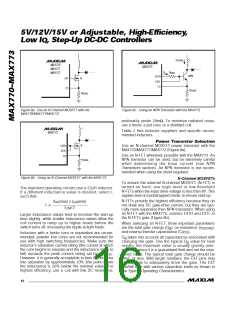
Figure 7b. Maximum Output Current vs. Input Voltage
(V = 12V)
OUT
OUT
0.8
0.6
0.4
0.2
3.5
3.0
2.5
VOUT = 15V
L = 22µH
V
= 24V
OUT
L =150µH
R
SENSE
= 40mΩ
R
SENSE
= 50mΩ
R
= 100mΩ
SENSE
R
SENSE
= 75mΩ
R
= 200mΩ
SENSE
2.0
1.5
1.0
R
= 100mΩ
= 200mΩ
SENSE
0.5
0
R
SENSE
= 400mΩ
R
SENSE
0
2
4
6
8
10
12
14
16
2
6
10
INPUT VOLTAGE (V)
14
INPUT VOLTAGE (V)
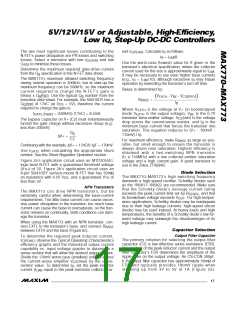
Figure 7c. Maximum Output Current vs. Input Voltage
(V = 15V)
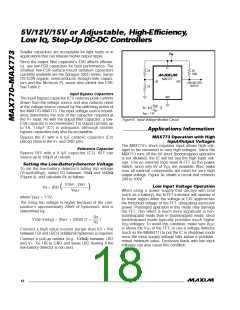
Figure 7d. Maximum Output Current vs. Input Voltage
(V = 24V)
OUT
OUT
sense-resistor value with an output current that is ade-
quate at the lowest input voltage.
De t e rm in in g R
S ENS E
The Typical Operating Characteristics graphs show the
outp ut c urre nt c a p a b ility for va rious mod e s , s e ns e
resistors, and input/output voltages. Use these graphs,
along with the theoretical output current curves shown
De t e rm in in g t h e In d u c t o r (L)
Practical inductor values range from 10µH to 300µH.
20µH is a good choice for most applications. In appli-
cations with large input/output differentials, the IC’s
output current capability will be much less when the
inductance value is too low, because the IC will always
operate in discontinuous mode. If the inductor value
is too low, the c urre nt will ra mp up to a hig h le ve l
b e fore the c urre nt-limit c omp a ra tor c a n turn off the
in Figures 7a-7d, to select R
. These theoretical
SENSE
curves assume that an external N-FET power switch is
used. They were derived using the minimum (worst-
case) current-limit comparator threshold value, and the
ind uc ta nc e va lue . No tole ra nc e wa s inc lud e d for
. The volta g e d rop a c ros s the d iod e wa s
assumed to be 0.5V, and the drop across the power
switch r and coil resistance was assumed to be
0.3V. To use the graphs, locate the graph with the
appropriate output voltage or the graph having the
nearest output voltage higher than the desired output
voltage. On this graph, find the curve for the largest
R
SENSE
switch. The minimum on-time for the switch (t (min))
ON
DS(ON)
is approximately 2µs; select an inductor that allows
the current to ramp up to I /2 in no less than 2µs.
LIM
Choosing a value of I /2 allows the half-size current
LIM
pulses to occur, increasing light-load efficiency and
minimizing output ripple.
______________________________________________________________________________________
15

 MAXIM [ MAXIM INTEGRATED PRODUCTS ]