AND8327/D
Combined loops gain
Combined loops phase
Phase
Gain (dB)
80
180
60
40
135
90
20
45
0
0
-20
-40
-60
-80
-45
-90
-135
-180
F (Hz)
10
100
1000
10000
100000
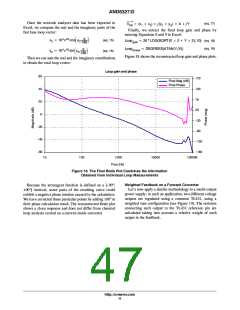
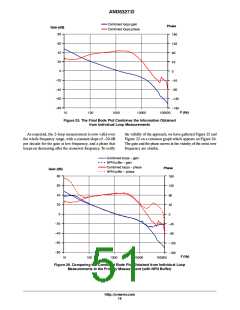
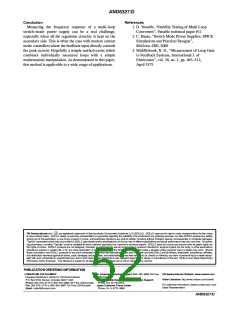
Figure 25. The Final Bode Plot Combines the Information Obtained
from Individual Loop Measurements
As expected, the 2-loop measurement is now valid over
the whole frequency range, with a constant slope of −20ꢀdB
per decade for the gain at low frequency, and a phase that
keeps on decreasing after the crossover frequency. To verify
the validity of the approach, we have gathered Figureꢀ25 and
Figureꢀ22 on a common graph which appears on Figureꢀ26.
The gain and the phase curves in the vicinity of the cross over
frequency are similar.
Combined loops - gain
NPN buffer - gain
Combined loops - phase
NPN buffer - phase
Phase
Gain (dB)
80
180
60
40
135
90
20
45
0
0
-20
-40
-60
-80
-45
-90
-135
-180
F (Hz)
10
100
1000
10000
100000
Figure 26. Comparing the Combined Bode Plot Obtained from Individual Loop
Measurements to the Primary Measurement (with NPN Buffer)
http://onsemi.com
15

 ETC [ ETC ]