AND8327/D
®
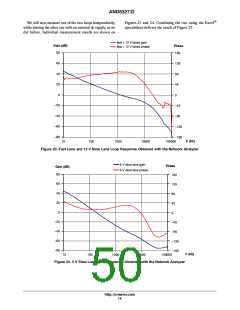
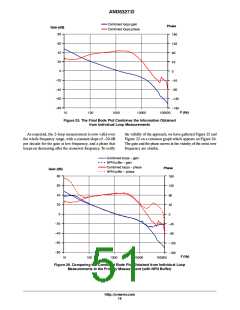
We will now measure one of the two loops independently,
while biasing the other one with an external dc supply, as we
did before. Individual measurement results are shown on
Figuresꢀ23 and 24. Combining the two using the Excel
spreadsheet delivers the result of Figure 25.
fast + 12 V lanes gain
fast + 12 V lanes phase
Gain (dB)
Phase
80
180
60
40
135
90
20
45
0
0
-20
-40
-60
-80
-45
-90
-135
-180
F (Hz)
10
100
1000
10000
100000
Figure 23. Fast Lane and 12 V Slow Lane Loop Response Obtained with the Network Analyzer
5 V slow lane gain
Phase
Gain (dB)
5 V slow lane phase
80
60
180
135
90
40
20
45
0
0
-20
-40
-60
-80
-45
-90
-135
-180
F (Hz)
10
100
1000
10000
100000
Figure 24. 5 V Slow Lane Loop Response Obtained with the Network Analyzer
http://onsemi.com
14

 ETC [ ETC ]