Le58083
Data Sheet
Notes:
1. See Figure 1 and Figure 2.
2. 0 dBm0 input signal, 300 Hz to 3400 Hz; measurement at any other frequency, 300 Hz to 3400 Hz.
3. No single frequency component in the range above 3800 Hz may exceed a level of –55 dBm0.
4. The weighted average of the crosstalk is defined by the following equation, where C(f) is the crosstalk in dB as a function of frequency, f
N
= 3300 Hz, f = 300 Hz, and the frequency points (f , j = 2..N) are closely spaced:
1
J
1
1
------
------
• C(fj)
• C(fj – 1)
1020
+ 1020
fj
---------------------------------------------------------------
---------
• log
∑
j – 1
f
2
j
---------------------------------------------------------------------------------------------------------
Average = 20 • log
f
N
----
log
1
f
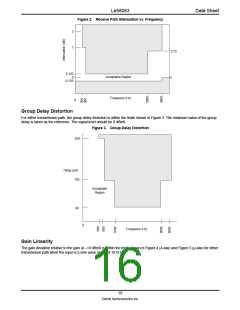
5. The End-to-End Group Delay is the sum of the transmit and receive group delays (both measured using the same time and clock slot).
6. Typical values not tested in production.
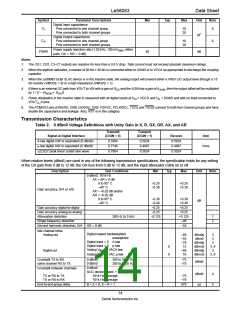
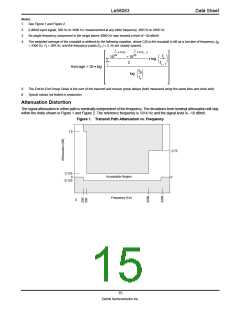
Attenuation Distortion
The signal attenuation in either path is nominally independent of the frequency. The deviations from nominal attenuation will stay
within the limits shown in Figure 1 and Figure 2. The reference frequency is 1014 Hz and the signal level is –10 dBm0.
Figure 1. Transmit Path Attenuation vs. Frequency
1.8
0.75
0.125
Acceptable Region
Frequency (Hz)
0
0
-0.125
0
15
Zarlink Semiconductor Inc.

 ZARLINK [ ZARLINK SEMICONDUCTOR INC ]