Le58083
Data Sheet
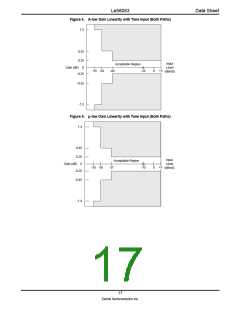
Total Distortion Including Quantizing Distortion
The signal to total distortion ratio will exceed the limits shown in Figure 6 for either path when the input signal is a sine wave
signal of frequency 1014 Hz.
Figure 6. Total Distortion with Tone Input (Both Paths)
Acceptable Region
B
A
A-Law
µ-Law
A
B
C
D
35.5dB 35.5dB
35.5dB 35.5dB
C
D
30dB
25dB
31dB
27dB
Signal-to-Total
Distortion (dB)
-45 -40
-30
0
Input Level (dBm0)
Discrimination Against Out-of-Band Input Signals
When an out-of-band sine wave signal of frequency f, and level A is applied to the analog input, there may be frequency
components below 4 kHz at the digital output which are caused by the out-of-band signal. These components are at least the
specified dB level below the level of a signal at the same output originating from a 1014 Hz sine wave signal with a level of A
dBm0 also applied to the analog input. The minimum specifications are shown in the following table.
Frequency of Out-of-Band Signal
16.6 Hz < f < 45 Hz
Amplitude of Out-of-Band Signal
–25 dBm0 < A ≤ 0 dBm0
–25 dBm0 < A ≤ 0 dBm0
–25 dBm0 < A ≤ 0 dBm0
–25 dBm0 < A ≤ 0 dBm0
–25 dBm0 < A ≤ 0 dBm0
Level below A
18 dB
25 dB
10 dB
see Figure 7
32 dB
45 Hz < f < 65 Hz
65 Hz < f < 100 Hz
3400 Hz < f < 4600 Hz
4600 Hz < f < 100 kHz
18
Zarlink Semiconductor Inc.

 ZARLINK [ ZARLINK SEMICONDUCTOR INC ]