Le58083
Data Sheet
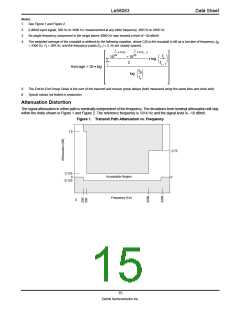
Figure 2. Receive Path Attenuation vs. Frequency
2
1
0.75
0.125
0
-0.125
Acceptable Region
Frequency (Hz)
0
0
Group Delay Distortion
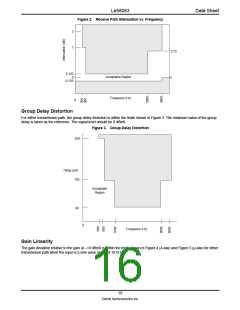
For either transmission path, the group delay distortion is within the limits shown in Figure 3. The minimum value of the group
delay is taken as the reference. The signal level should be 0 dBm0.
Figure 3. Group Delay Distortion
420
Delay (µS)
150
Acceptable
Region
90
0
Frequency (Hz)
Gain Linearity
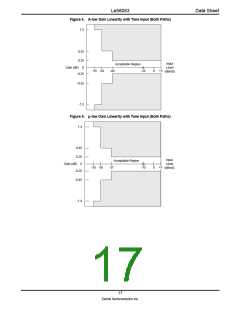
The gain deviation relative to the gain at –10 dBm0 is within the limits shown in Figure 4 (A-law) and Figure 5 (µ-law) for either
transmission path when the input is a sine wave signal of 1014 Hz.
16
Zarlink Semiconductor Inc.

 ZARLINK [ ZARLINK SEMICONDUCTOR INC ]