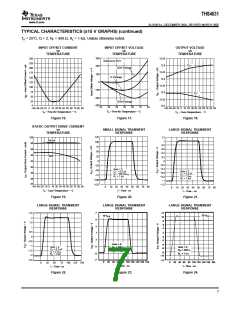
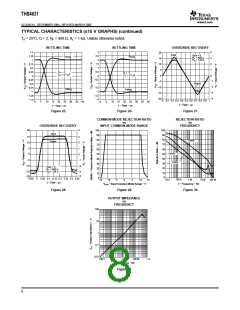
THS4631
www.ti.com
SLOS451A–DECEMBER 2004–REVISED MARCH 2005
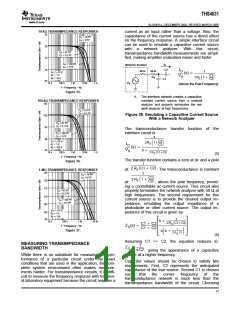
10-kΩ TRANSIMPEDANCE RESPONSES
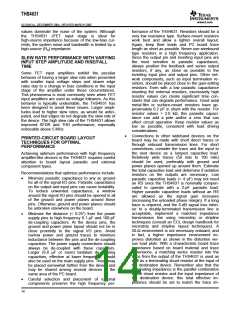
current as an input rather than a voltage. Also, the
capacitance of the current source has a direct effect
on the frequency response. A simple interface circuit
can be used to emulate a capacitive current source
85
80
75
C
C
= 18 PF
= 2 PF
S
F
with
a
network analyzer. With this circuit,
C
C
= 47 PF
= 2.2 PF
S
transimpedance bandwidth measurements are simpli-
fied, making amplifier evaluation easier and faster.
F
C
C
= 100 PF
= 3 PF
S
I
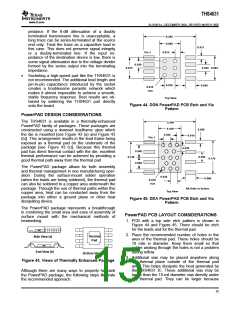
O
Network Analizer
F
C2
70
65
I
50 W
50 W
O
1
V
R
R
= ±15 V
= 1 k
= 10 k
S
(s) +
L
F
C1
C2
V
ǒ1 )
Ǔ
S
R
S
2RS
C1
V
S
10 k
100 k
1 M
10 M
1 G
(Above the Pole Frequency)
f − Frequency − Hz
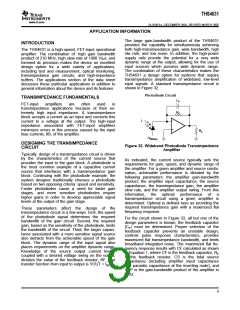
Figure 35.
A. The interface network creates a capacitive,
constant current source from network
100-kΩ TRANSIMPEDANCE RESPONSES
a
105
analyzer and properly terminates the net-
work analyzer at high frequencies.
C
C
= 18 PF
= 0.5 PF
S
F
Figure 38. Emulating a Capacitive Current Source
With a Network Analyzer
100
95
C
C
= 47 PF
= 0.7 PF
S
F
The transconductance transfer function of the
C
= 100 PF
= 1 PF
interface circuit is:
S
C
F
s
90
85
V
R
R
= ±15 V
= 1 k
= 100 k
C1
C2
S
ǒ1)
Ǔ
2RS
I
L
O
(s) +
F
1
V
s ) 2 R
S
ǒ
Ǔ
C1)C2
10 k
100 k
1 M
10 M
1 G
S
(3)
f − Frequency − Hz
The transfer function contains a zero at dc and a pole
Figure 36.
1
(
)
2 RS C1 ) C2
at:
. The transconductance is constant
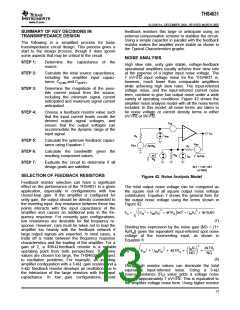
1-MΩ TRANSIMPEDANCE RESPONSES
125
1
C
C
= 18 PF
= 0 PF
S
C1
F
ǒ1 ) C2Ǔ
2 RS
120
115
at:
, above the pole frequency, provid-
ing a controllable ac-current source. This circuit also
properly terminates the network analyzer with 50 Ω at
high frequencies. The second requirement for this
current source is to provide the desired output im-
pedance, emulating the output impedance of a
photodiode or other current source. The output im-
pedance of this circuit is given by:
C
C
= 47 PF
= 0.2 PF
S
F
110
105
C
C
= 100 PF
= 0.2 PF
S
F
V
R
R
= ±15 V
= 1 k
= 1 M
S
100
95
L
F
1
ȱs )
ȳ
ȧ
10 k
100 k
1 M
10 M
ǒ
Ǔ
2RS C1)C2
C1 ) C2
Z (s) +
f − Frequency − Hz
ȧ
O
C1 C2
1
Figure 37.
ǒ
Ǔ
s s ) 2 R
C1
S
(4)
Assuming C1 >> C2, the equation reduces to:
MEASURING TRANSIMPEDANCE
BANDWIDTH
1
ZO
[
sC2
, giving the appearance of a capacitive
source at a higher frequency.
While there is no substitute for measuring the per-
formance of a particular circuit under the exact
conditions that are used in the application, the com-
plete system environment often makes measure-
ments harder. For transimpedance circuits, it is diffi-
cult to measure the frequency response with tradition-
al laboratory equipment because the circuit requires a
Capacitor values should be chosen to satisfy two
requirements. First, C2 represents the anticipated
capacitance of the true source. Second C1 is chosen
such
that
the
corner
frequency
of
the
transconductance network is much less than the
transimpedance bandwidth of the circuit. Choosing
11

 TI [ TEXAS INSTRUMENTS ]