AD7769
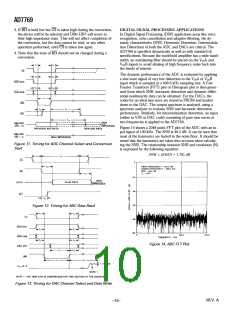
3. If RD is held low but CS is taken high during the conversion,
the device will be de-selected and DB0–DB7 will revert to
their high impedance state. T his will not affect completion of
the conversion, but the data cannot be read, or any other
operation performed, until CS is taken low again.
D IGITAL SIGNAL P RO CESSING AP P LICATIO NS
In Digital Signal Processing (DSP) application areas like voice
recognition, echo cancellation and adaptive filtering, the dy-
namic characteristics (SNR, Harmonic Distortion, Intermodula-
tion Distortion) of both the ADC and DACs are critical. T he
AD7769 is specified dynamically as well as with standard dc
specifications. Because the track/hold amplifier has a wide band-
width, an antialiasing filter should be placed on the VINA and
4. Note that the state of RD should not be changed during a
conversion.
VINB inputs to avoid aliasing of high frequency noise back into
the bands of interest.
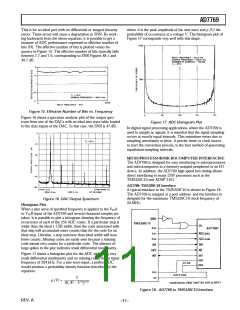
T he dynamic performance of the ADC is evaluated by applying
a sine wave signal of very low distortion to the VINA or VIN
B
input which is sampled at a 409.6 kHz sampling rate. A Fast
Fourier T ransform (FFT ) plot or Histogram plot is then gener-
ated from which SNR, harmonic distortion and dynamic differ-
ential nonlinearity data can be obtained. For the DACs, the
codes for an ideal sine wave are stored in PROM and loaded
down to the DAC. T he output spectrum is analyzed, using a
spectrum analyzer to evaluate SNR and harmonic distortion
performance. Similarly, for intermodulation distortion, an input
(either to VIN or DAC code) consisting of pure sine waves at
two frequencies is applied to the AD7769.
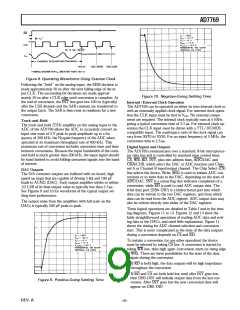
Figure 14 shows a 2048 point FFT plot of the ADC with an in-
put signal of 130 kHz. T he SNR is 49.2 dB. It can be seen that
most of the harmonics are buried in the noise floor. It should be
noted that the harmonics are taken into account when calculat-
ing the SNR. T he relationship between SNR and resolution (N)
is expressed by the following equation:
Figure 11. Tim ing for ADC Channel Select and Conversion
Start
SNR = (6.02N + 1.76) dB
Figure 12. Tim ing for ADC Data Read
Figure 14. ADC FFT Plot
Figure 13. Tim ing for DAC Channel Select and Data Write
REV. A
–10–

 ADI [ ADI ]