AND8327/D
re_fast
im_fast
re_slow
im_slow
sum
sum
1
2
3
4
5
6
5.00
-5.00
-15.0
-25.0
-35.0
Re_slow
315
Re_fast
Re_fast + Re_slow (Y)
160
120
80.0
40.0
0
Im_slow + Im_fast (X)
Im_fast
26
4
Im_slow
10
100
1k
10k
100k
frequency in hertz
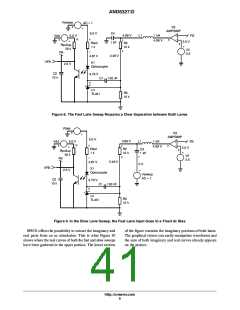
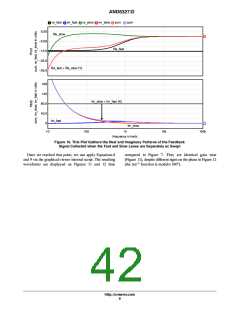
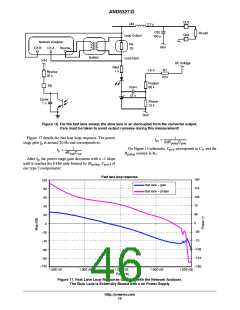
Figure 10. This Plot Gathers the Real and Imaginary Portions of the Feedback
Signal Collected when the Fast and Slow Lanes are Separately ac Swept
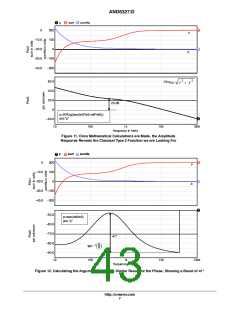
Once we reached that point, we can apply Equationsꢀ8
andꢀ9 via the graphical viewer internal script. The resulting
waveforms are displayed on Figures 11 and 12 then
compared to Figure 7. They are identical gain wise
(Figureꢀ11), despite different signs on the phase in Figureꢀ12
-1
(the tan function is modulo 180°).
http://onsemi.com
6

 ETC [ ETC ]