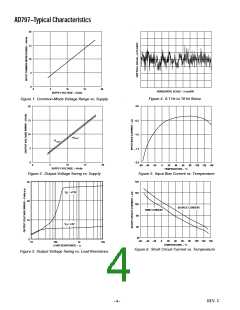
AD797–Typical Characteristics
20
15
10
5
0
0
5
10
15
20
HORIZONTAL SCALE – 5 sec/DIV
SUPPLY VOLTAGE – ±Volts
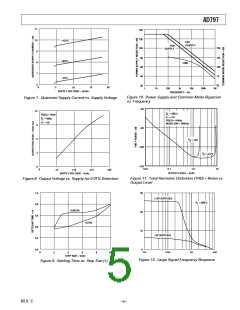
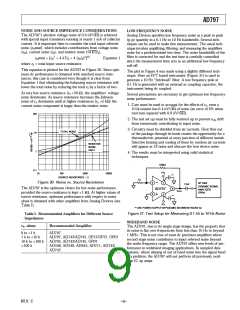
Figure 4. 0.1 Hz to 10 Hz Noise
Figure 1. Com m on-Mode Voltage Range vs. Supply
0.0
20
15
10
–0.5
–1.0
+V
OUT
–V
OUT
5
0
–1.5
–2.0
0
5
10
SUPPLY VOLTAGE – ±Volts
15
20
–60 –40 –20
0
20
40
60
80
100 120 140
TEMPERATURE – °C
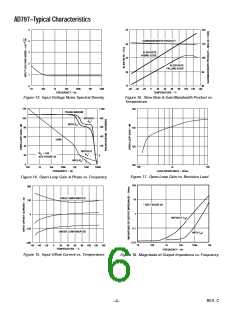
Figure 5. Input Bias Current vs. Tem perature
Figure 2. Output Voltage Swing vs. Supply
140
30
20
10
0
V
= ±15V
S
120
100
80
SOURCE CURRENT
SINK CURRENT
V
= ±5V
S
60
40
–60 –40 –20
0
20
40
60
100 120 140
80
10
100
1k
10k
TEMPERATURE – °C
LOAD RESISTANCE –
Ω
Figure 6. Short Circuit Current vs. Tem perature
Figure 3. Output Voltage Swing vs. Load Resistance
REV. C
–4–

 ETC [ ETC ]