TMC248-LA DATASHEET (Rev. 1.01 / 2013-MAR-26)
8
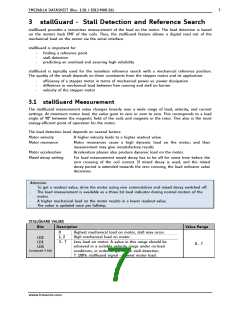
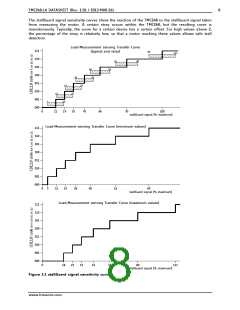
The stallGuard signal sensitivity curves show the reaction of the TMC248 to the stallGuard signal taken
from measuring the motor. A certain stray occurs within the TMC248, but the resulting curve is
monotonously. Typically, the curve for a certain device has a certain offset. For high values above 2,
the percentage of the stray is relatively low, so that a motor reaching these values allows safe stall
detection.
Load-Measurement sensing Transfer Curve
111
(typical and stray)
89
111
110
61
80
101
100
011
010
001
000
40
56
28
43
19
33
12
25
5
18
0
11
19
35
95
48
70
100
stallGuard signal [% maximum]
Load-Measurement sensing Transfer Curve (minimum values)
111
110
101
100
011
010
001
000
0
5
12
19
28
40
61
89
stallGuard signal [% maximum]
Load-Measurement sensing Transfer Curve (maximum values)
111
110
101
100
011
010
001
000
0
18
25
33
43
56
80
111
stallGuard signal [% maximum]
Figure 3.1 stallGuard signal sensitivity curves
www.trinamic.com

 TRINAMIC [ TRINAMIC MOTION CONTROL GMBH & CO. KG. ]