DM385, DM388
SPRS821D –MARCH 2013–REVISED DECEMBER 2013
www.ti.com
8.5 Emulation Features and Capability
8.5.1 Advanced Event Triggering (AET)
The device supports Advanced Event Triggering (AET). This capability can be used to debug complex
problems as well as understand performance characteristics of user applications. AET provides the
following capabilities:
•
Hardware Program Breakpoints: specify addresses or address ranges that can generate events such
as halting the processor or triggering the trace capture.
•
Data Watchpoints: specify data variable addresses, address ranges, or data values that can generate
events such as halting the processor or triggering the trace capture.
•
•
Counters: count the occurrence of an event or cycles for performance monitoring.
State Sequencing: allows combinations of hardware program breakpoints and data watchpoints to
precisely generate events for complex sequences.
For more information on AET, see the following documents:
•
Using Advanced Event Triggering to Find and Fix Intermittent Real-Time Bugs application report
(Literature Number: SPRA753).
•
Using Advanced Event Triggering to Debug Real-Time Problems in High Speed Embedded
Microprocessor Systems application report (Literature Number: SPRA387).
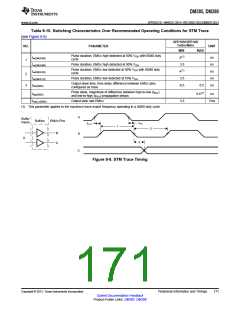
8.5.2 Trace
The device supports Trace at the Cortex™-A8 and System levels. Trace is a debug technology that
provides a detailed, historical account of application code execution, timing, and data accesses. Trace
collects, compresses, and exports debug information for analysis. The debug information can be exported
to the Embedded Trace Buffer (ETB), or to the 5-pin Trace Interface (system trace only). Trace works in
real-time and does not impact the execution of the system.
For more information on board design guidelines for Trace Advanced Emulation, see the Emulation and
Trace Headers Technical Reference Manual (Literature Number: SPRU655).
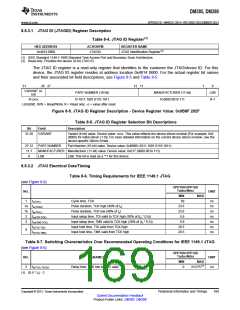
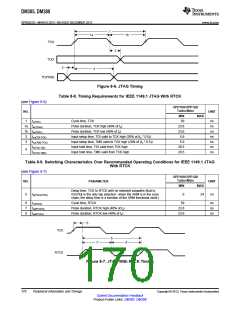
8.5.3 IEEE 1149.1 JTAG
The JTAG (IEEE Standard 1149.1-1990 Standard-Test-Access Port and Boundary Scan Architecture)
interface is used for BSDL testing and emulation of the device. The TRST pin only needs to be released
when it is necessary to use a JTAG controller to debug the device or exercise the device's boundary scan
functionality. For maximum reliability, the device includes an internal pulldown (IPD) on the TRST pin to
ensure that TRST is always asserted upon power up and the device's internal emulation logic is always
properly initialized. JTAG controllers from Texas Instruments actively drive TRST high. However, some
third-party JTAG controllers may not drive TRST high but expect the use of a pullup resistor on TRST.
When using this type of JTAG controller, assert TRST to initialize the device after powerup and externally
drive TRST high before attempting any emulation or boundary-scan operations.
The main JTAG features include:
•
•
•
•
•
32KB embedded trace buffer (ETB)
5-pin system trace interface for debug
Supports Advanced Event Triggering (AET)
All processors can be emulated via JTAG ports
All functions on EMU pins of the device:
–
–
EMU[1:0] - cross-triggering, boot mode (WIR), STM trace
EMU[4:2] - STM trace only (single direction)
168
Peripheral Information and Timings
Copyright © 2013, Texas Instruments Incorporated
Submit Documentation Feedback
Product Folder Links: DM385 DM388

 TI [ TEXAS INSTRUMENTS ]