ADS1299
SBAS499A –JULY 2012–REVISED AUGUST 2012
www.ti.com
PARAMETRIC MEASUREMENT INFORMATION
NOISE MEASUREMENTS
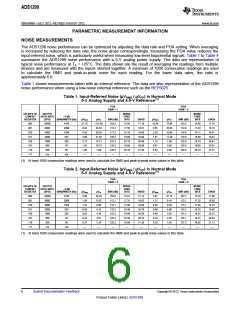
The ADS1299 noise performance can be optimized by adjusting the data rate and PGA setting. When averaging
is increased by reducing the data rate, the noise drops correspondingly. Increasing the PGA value reduces the
input-referred noise, which is particularly useful when measuring low-level biopotential signals. Table 1 to Table 4
summarize the ADS1299 noise performance with a 5-V analog power supply. The data are representative of
typical noise performance at TA = +25°C. The data shown are the result of averaging the readings from multiple
devices and are measured with the inputs shorted together. A minimum of 1000 consecutive readings are used
to calculate the RMS and peak-to-peak noise for each reading. For the lower data rates, the ratio is
approximately 6.6.
Table 1 shows measurements taken with an internal reference. The data are also representative of the ADS1299
noise performance when using a low-noise external reference such as the REF5025.
Table 1. Input-Referred Noise (μVRMS / μVPP) in Normal Mode
5-V Analog Supply and 4.5-V Reference(1)
PGA
PGA
GAIN = 1
GAIN = 2
DR BITS OF
CONFIG1
REGISTER
OUTPUT
DATA RATE
(SPS)
NOISE-
FREE
BITS
NOISE-
FREE
BITS
–3-dB
BANDWIDTH (Hz)
μVRMS
21.70
6.93
4.33
3.06
2.17
1.53
1.08
—
μVPP
151.89
48.53
30.34
21.45
15.17
10.73
7.59
SNR (dB)
103.3
113.2
117.3
120.3
123.3
126.3
129.3
—
ENOB
17.16
18.81
19.49
19.99
20.49
20.99
21.48
—
μVRMS
10.85
3.65
2.28
1.61
1.14
0.81
0.57
—
μVPP
75.94
25.52
15.95
11.29
7.98
5.65
3.99
—
SNR (dB)
103.3
112.8
116.9
119.9
122.9
125.9
128.9
—
ENOB
17.16
18.74
19.41
19.91
20.41
20.91
21.41
—
000
001
010
011
100
101
110
111
16000
8000
4000
2000
1000
500
4193
2096
1048
524
262
131
65
15.85
17.50
18.18
18.68
19.18
19.68
20.18
—
15.85
17.43
18.11
18.60
19.10
19.60
20.10
—
250
n/a
n/a
—
(1) At least 1000 consecutive readings were used to calculate the RMS and peak-to-peak noise values in this table.
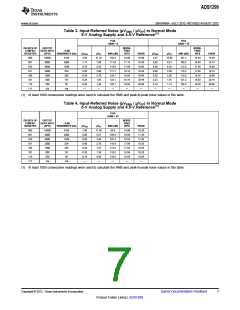
Table 2. Input-Referred Noise (μVRMS / μVPP) in Normal Mode
5-V Analog Supply and 4.5-V Reference(1)
PGA
PGA
GAIN = 4
GAIN = 6
DR BITS OF
CONFIG1
REGISTER
OUTPUT
DATA RATE
(SPS)
NOISE-
FREE
BITS
NOISE-
FREE
BITS
–3-dB
BANDWIDTH (Hz)
μVRMS
5.60
1.98
1.24
0.88
0.62
0.44
0.31
—
μVPP
39.23
13.87
8.66
6.13
4.34
3.07
2.16
—
SNR (dB)
103.0
112.1
116.1
119.2
122.2
125.2
128.2
—
ENOB
17.12
18.62
19.29
19.79
20.29
20.79
21.30
—
μVRMS
3.87
1.31
0.93
0.66
0.46
0.33
0.23
—
μVPP
27.10
9.19
6.50
4.60
3.25
2.30
1.62
—
SNR (dB)
102.7
112.1
115.1
118.1
121.1
124.1
127.2
—
ENOB
17.06
18.62
19.12
19.62
20.12
20.62
21.13
—
000
001
010
011
100
101
110
111
16000
8000
4000
2000
1000
500
4193
2096
1048
524
262
131
65
15.81
17.31
17.99
18.49
18.99
19.49
19.99
—
15.76
17.32
17.82
18.32
18.81
19.31
19.82
—
250
n/a
n/a
(1) At least 1000 consecutive readings were used to calculate the RMS and peak-to-peak noise values in this table.
6
Submit Documentation Feedback
Copyright © 2012, Texas Instruments Incorporated
Product Folder Link(s): ADS1299

 TI [ TEXAS INSTRUMENTS ]