Philips Semiconductors Linear Products
Product specification
Tone decoder/phase-locked loop
NE/SE567
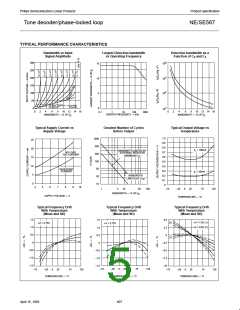
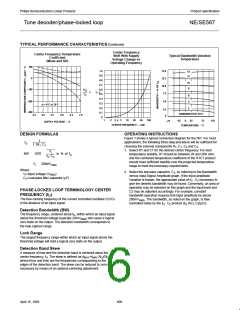
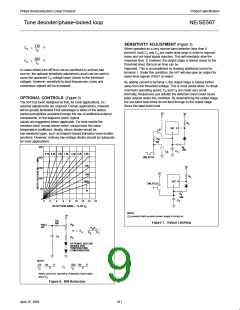
TYPICAL PERFORMANCE CHARACTERISTICS (Continued)
Center Frequency
Center Frequency Temperature
Coefficient
Typical Bandwidth Variation
Shift With Supply
Voltage Change vs
Operating Frequency
Temperature
(Mean and SD)
100
0
1.0
0.9
0.8
0.7
0.6
15.0
12.5
10.0
7.5
14
12
10
8
–100
Dt
O
V
% V
t
0.5
0.4
0.3
0.2
0.1
0
O
6
4
–200
–300
5.0
∆t = 0°C to 70°C
2
2.5
0
BANDWIDTH AT 25°C
4.5
5.0
5.5
6.0
6.5
7.0
1
2
3 4
5
10
20
40
100
–25
0
25
75
125
–75
SUPPLY VOLTAGE — V
CENTER FREQUENCY — kHz
TEMPERATURE – °C
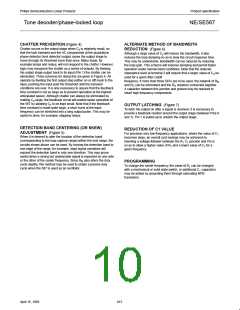
DESIGN FORMULAS
OPERATING INSTRUCTIONS
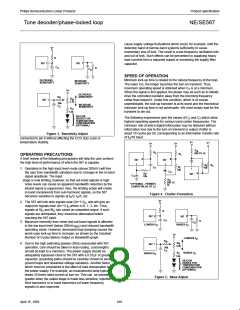
Figure 1 shows a typical connection diagram for the 567. For most
applications, the following three-step procedure will be sufficient for
1
fO
1.1R1 C1
choosing the external components R , C , C and C .
1
1
2
3
1. Select R1 and C1 for the desired center frequency. For best
temperature stability, R1 should be between 2K and 20K ohm,
and the combined temperature coefficient of the R1C1 product
should have sufficient stability over the projected temperature
range to meet the necessary requirements.
VI
BW
1070
in % of fO
fO C2
VI
200mVRMS
Where
2. Select the low-pass capacitor, C , by referring to the Bandwidth
2
V =Input voltage (V
)
I
RMS
versus Input Signal Amplitude graph. If the input amplitude
C =Low-pass filter capacitor (µF)
2
Variation is known, the appropriate value of f C necessary to
O
2
give the desired bandwidth may be found. Conversely, an area of
operation may be selected on this graph and the input level and
C2 may be adjusted accordingly. For example, constant
bandwidth operation requires that input amplitude be above
PHASE-LOCKED LOOP TERMINOLOGY CENTER
FREQUENCY (f )
O
The free-running frequency of the current controlled oscillator (CCO)
in the absence of an input signal.
200mV
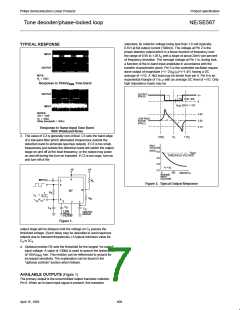
. The bandwidth, as noted on the graph, is then
RMS
controlled solely by the f C product (f (Hz), C2(µF)).
O
2
O
Detection Bandwidth (BW)
The frequency range, centered about f , within which an input signal
O
above the threshold voltage (typically 20mV
) will cause a logical
RMS
zero state on the output. The detection bandwidth corresponds to
the loop capture range.
Lock Range
The largest frequency range within which an input signal above the
threshold voltage will hold a logical zero state on the output.
Detection Band Skew
A measure of how well the detection band is centered about the
center frequency, f . The skew is defined as (f
+f -2f )/2f
MAX MIN O O
O
where fmax and fmin are the frequencies corresponding to the
edges of the detection band. The skew can be reduced to zero if
necessary by means of an optional centering adjustment.
408
April 15, 1992

 NXP [ NXP ]