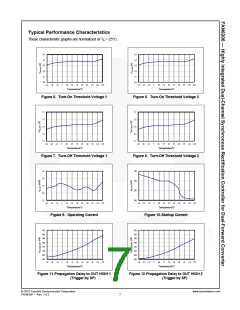
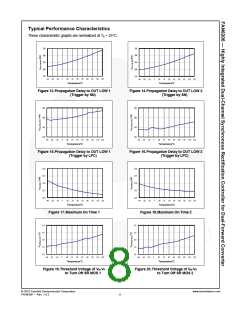
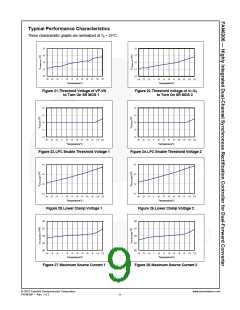
Typical Performance Characteristics
These characteristic graphs are normalized at TA = 25°C.
8.5
8.4
8.3
8.2
8.1
8.0
8.5
8.4
8.3
8.2
8.1
8.0
-40 -25 -10
5
20
35
50
65
80
95
110 125
-40 -25 -10
5
20
35
50
65
80
95
110 125
Temperature℃
Temperature℃
Figure 5. Turn-On Threshold Voltage 1
Figure 6. Turn-On Threshold Voltage 2
7.7
7.6
7.5
7.4
7.3
7.7
7.6
7.5
7.4
7.3
-40 -25 -10
5
20
35
50
65
80
95
110 125
-40 -25 -10
5
20
35
50
65
80
95
110 125
Temperature℃
Temperature℃
Figure 7. Turn-Off Threshold Voltage 1
Figure 8. Turn-Off Threshold Voltage 2
2.9
2.8
2.7
2.6
2.5
500
400
300
200
-40 -25 -10
5
20
35
50
65
80
95
110 125
-40 -25 -10
5
20
35
50
65
80
95
110 125
Temperature℃
Temperature℃
Figure 9. Operating Current
Figure 10.Startup Current
420
400
380
360
340
320
300
280
420
400
380
360
340
320
300
280
-40 -25 -10
5
20
35
50
65
80
95
110 125
-40 -25 -10
5
20
35
50
65
80
95
110 125
Temperature℃
Temperature℃
Figure 11.Propagation Delay to OUT HIGH 1
(Trigger by SP)
Figure 12.Propagation Delay to OUT HIGH 2
(Trigger by SP)
© 2010 Fairchild Semiconductor Corporation
FAN6206 • Rev. 1.0.2
www.fairchildsemi.com
7

 FAIRCHILD [ FAIRCHILD SEMICONDUCTOR ]