CS3310
> 1/8"
Digital Ground Plane
Analog Ground Plane
10
Ω
10
µF
+
+
F
VA+
VA-
µ
10
10
µF
+
0.1
µF
µ
0.1 F
0.1
µ
F
CPU & Digital
Logic
Analog Signals
and Circuits
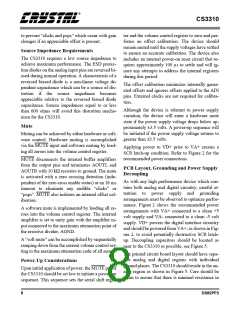
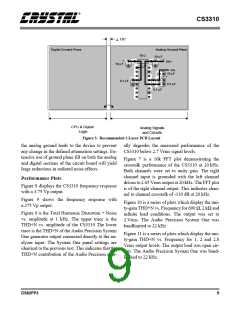
Figure 5. Recommended 2-Layer PCB Layout
the analog ground leads to the device to prevent
any change in the defined attenuation settings. Ex-
tensive use of ground plane fill on both the analog
and digital sections of the circuit board will yield
large reductions in radiated noise effects.
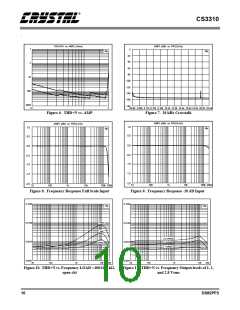
ally degrades the measured performance of the
CS3310 below 2.7 Vrms signal levels.
Figure 7 is a 16k FFT plot demonstrating the
crosstalk performance of the CS3310 at 20 kHz.
Both channels were set to unity gain. The right
channel input is grounded with the left channel
driven to 2.65 Vrms output at 20 kHz. The FFT plot
is of the right channel output. This indicates chan-
nel to channel crosstalk of -130 dB at 20 kHz.
Performance Plots
Figure 8 displays the CS3310 frequency response
with a 3.75 Vp output.
Figure 9 shows the frequency response with
a.375 Vp output.
Figure 10 is a series of plots which display the uni-
ty-gain THD+N vs. Frequency for 600 Ω, 2 kΩ and
infinite load conditions. The output was set to
2 Vrms. The Audio Precision System One was
bandlimited to 22 kHz
Figure 6 is the Total Harmonic Distortion + Noise
vs. amplitude at 1 kHz. The upper trace is the
THD+N vs. amplitude of the CS3310 The lower
trace is the THD+N of the Audio Precision System
One generator output connected directly to the an-
alyzer input. The System One panel settings are
identical to the previous test. This indicates that the
THD+N contribution of the Audio Precision actu-
Figure 11 is a series of plots which display the uni-
ty-gain THD+N vs. Frequency for 1, 2 and 2.8
Vrms output levels. The output load was open cir-
cuit. The Audio Precision System One was band-
limited to 22 kHz.
DS82PP3
9

 CIRRUS [ CIRRUS LOGIC ]