AD7870/AD7875/AD7876
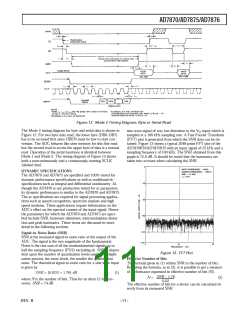
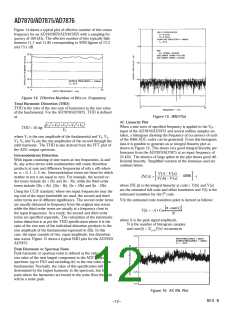
Figure 14 shows a typical plot of effective number of bits versus
frequency for an AD7870KN/AD7875KN with a sampling fre-
quency of 100 kHz. T he effective number of bits typically falls
between 11.7 and 11.85 corresponding to SNR figures of 72.2
and 73.1 dB.
Figure 14. Effective Num ber of Bits vs. Frequency
Total H ar m onic D istor tion (TH D )
T HD is the ratio of the rms sum of harmonics to the rms value
of the fundamental. For the AD7870/AD7875, T HD is defined
as
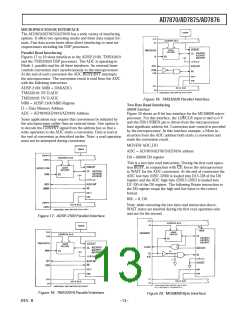
Figure 15. IMD Plot
AC Linear ity P lot
V2 2 +V3 2 +V4 2 +V5 2 +V6
2
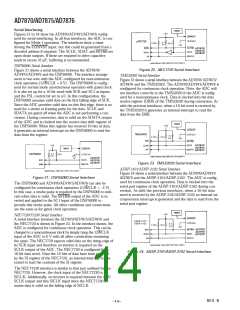
When a sine wave of specified frequency is applied to the VIN
input of the AD7870/AD7875 and several million samples are
taken, a histogram showing the frequency of occurrence of each
of the 4096 ADC codes can be generated. From this histogram
data it is possible to generate an ac integral linearity plot as
shown in Figure 16. T his shows very good integral linearity per-
formance from the AD7870/AD7875 at an input frequency of
25 kHz. T he absence of large spikes in the plot shows good dif-
ferential linearity. Simplified versions of the formulae used are
outlined below.
THD = 20 log
V1
where V1 is the rms amplitude of the fundamental and V2, V3,
V4, V5 and V6 are the rms amplitudes of the second through the
sixth harmonic. T he T HD is also derived from the FFT plot of
the ADC output spectrum.
Inter m odulation D istor tion
With inputs consisting of sine waves at two frequencies, fa and
fb, any active device with nonlinearities will create distortion
products at sum and difference frequencies of mfa ± nfb where
m, n = 0, 1, 2, 3, etc. Intermodulation terms are those for which
neither m nor n are equal to zero. For example, the second or-
der terms include (fa + fb) and (fa – fb), while the third order
terms include (2fa + fb), (2fa – fb), (fa + 2fb) and (fa – 2fb).
V(i) –V(o)
4096
INL(i) =
–i
V( fs) –V(o)
where INL(i) is the integral linearity at code i. V(fs) and V(o)
are the estimated full-scale and offset transitions and V(i) is the
estimated transition for the ith code.
Using the CCIF standard, where two input frequencies near the
top end of the input bandwidth are used, the second and third
order terms are of different significance. T he second order terms
are usually distanced in frequency from the original sine waves
while the third order terms are usually at a frequency close to
the input frequencies. As a result, the second and third order
terms are specified separately. T he calculation of the intermodu-
lation distortion is as per the T HD specification where it is the
ratio of the rms sum of the individual distortion products to the
rms amplitude of the fundamental expressed in dBs. In this
case, the input consists of two, equal amplitude, low distortion
sine waves. Figure 15 shows a typical IMD plot for the AD7870/
AD7875.
V(i) the estimated code transition point is derived as follows:
π cum(i)
[
]
V(i) = –A • Cos
N
where A is the peak signal amplitude,
N is the number of histogram samples
and cum(i) = Σin=0V(n) occurrences
P eak H ar m onic or Spur ious Noise
Peak harmonic or spurious noise is defined as the ratio of the
rms value of the next largest component in the ADC output
spectrum (up to FS/2 and excluding dc) to the rms value of the
fundamental. Normally, the value of this specification will be
determined by the largest harmonic in the spectrum, but for
parts where the harmonics are buried in the noise floor the peak
will be a noise peak.
Figure 16. AC INL Plot
REV. B
–12–

 ADI [ ADI ]