TPS1HC30-Q1
ZHCSP75A –JULY 2022 –REVISED DECEMBER 2022
www.ti.com.cn
3
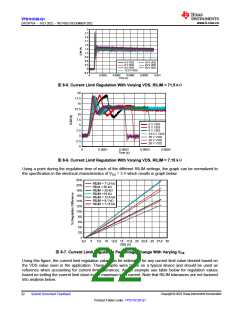
2.7
2.4
2.1
1.8
1.5
1.2
0.9
0.6
0.3
0
5 V VDS
6 V VDS
9 V VDS
13.5 V VDS
18 V VDS
24 V VDS
28 V VDS
-0.3
0
0.0002
0.0004
0.0006
0.0008
0.001
Time (s)
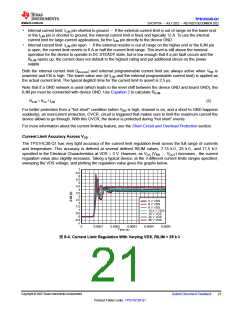
图8-5. Current Limit Regulation With Varying VDS, RILIM = 71.5 kΩ
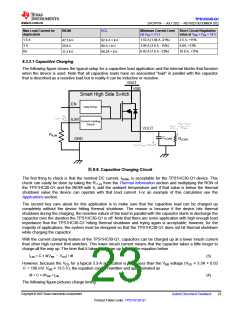
20
17.5
15
12.5
10
7.5
5 V VDS
6 V VDS
5
2.5
0
9 V VDS
13.5 V VDS
18 V VDS
24 V VDS
28 V VDS
-2.5
-5
0
0.0001
0.0002
0.0003
0.0004
Time (s)
图8-6. Current Limit Regulation With Varying VDS, RILIM = 7.15 kΩ
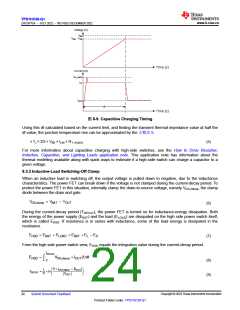
Using a point during the regulation time of each of the different RILIM settings, the graph can be normalized to
the specification in the electrical characteristics of VDS = 3 V which results in graph below.
图8-7. Current Limit Regulation Percentage Change With Varying VDS
Using this figure, the current limit regulation value can be estimated for any current limit value desired based on
the VDS value seen in the application. These graphs were taken on a typical device and should be used as
reference when accounting for current limit tolerances. As an example see table below for regulation values
based on setting the current limit close to the maximum load current. Note that RILIM tolerances are not factored
into analysis below.
Copyright © 2023 Texas Instruments Incorporated
22
Submit Document Feedback
Product Folder Links: TPS1HC30-Q1

 TI [ TEXAS INSTRUMENTS ]