DLPA2000
www.ti.com.cn
ZHCSCO5B –JUNE 2014–REVISED FEBRUARY 2018
Typical Projector Application (continued)
8.2.3 Application Curve
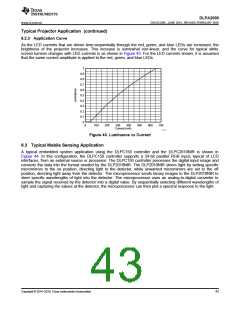
As the LED currents that are driven time-sequentially through the red, green, and blue LEDs are increased, the
brightness of the projector increases. This increase is somewhat non-linear, and the curve for typical white
screen lumens changes with LED currents is as shown in Figure 43. For the LED currents shown, it is assumed
that the same current amplitude is applied to the red, green, and blue LEDs.
SPACE
1
0.9
0.8
0.7
0.6
0.5
0.4
0.3
0.2
0.1
0
0
100
200
300
400
500
600
700
Current (mA)
D001
Figure 43. Luminance vs Current
8.3 Typical Mobile Sensing Application
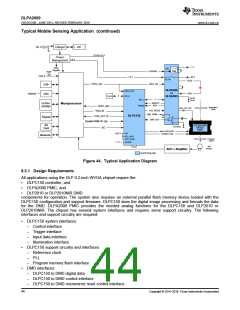
A typical embedded system application using the DLPC150 controller and the DLPC2010NIR is shown in
Figure 44. In this configuration, the DLPC150 controller supports a 24-bit parallel RGB input, typical of LCD
interfaces, from an external source or processor. The DLPC150 controller processes the digital input image and
converts the data into the format needed by the DLP2010NIR. The DLP2010NIR steers light by setting specific
micromirrors to the on position, directing light to the detector, while unwanted micromirrors are set to the off
position, directing light away from the detector. The microprocessor sends binary images to the DLP2010NIR to
steer specific wavelengths of light into the detector. The microprocessor uses an analog-to-digital converter to
sample the signal received by the detector into a digital value. By sequentially selecting different wavelengths of
light and capturing the values at the detector, the microprocessor can then plot a spectral response to the light.
Copyright © 2014–2018, Texas Instruments Incorporated
43

 TI [ TEXAS INSTRUMENTS ]