DLPA2000
www.ti.com.cn
ZHCSCO5B –JUNE 2014–REVISED FEBRUARY 2018
Typical Mobile Sensing Application (continued)
8.3.2 Detailed Design Procedure
8.3.2.1 Dlpc150 System Interfaces
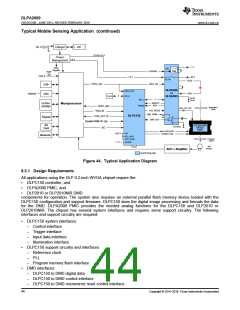
The 0.2-inch WVGA chipset supports a 16-bit or 24-bit parallel RGB interface for image data transfers from
another device. There are two primary output interfaces: Illumination driver control interface and sync outputs.
8.3.2.1.1 Control Interface
The 0.2-inch WVGA chipset supports I2C commands through the control interface. The control interface allows
another master processor to send commands to the DLPC150 controller to query system status or perform
realtime operations, such as LED driver current settings.
8.3.3 Application Curve
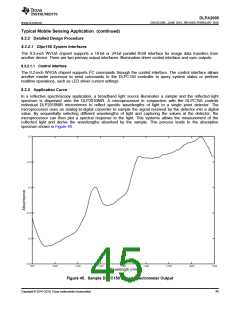
In a reflective spectroscopy application, a broadband light source illuminates a sample and the reflected light
spectrum is dispersed onto the DLP2010NIR. A microprocessor in conjunction with the DLPC150 controls
individual DLP2010NIR micromirrors to reflect specific wavelengths of light to a single point detector. The
microprocessor uses an analog-to-digital converter to sample the signal received by the detector into a digital
value. By sequentially selecting different wavelengths of light and capturing the values at the detector, the
microprocessor can then plot a spectral response to the light. This systems allows the measurement of the
collected light and derive the wavelengths absorbed by the sample. This process leads to the absorption
spectrum shown in Figure 45.
Figure 45. Sample DLPC150 Based Spectrometer Output
Copyright © 2014–2018, Texas Instruments Incorporated
45

 TI [ TEXAS INSTRUMENTS ]