TDA8922B
Philips Semiconductors
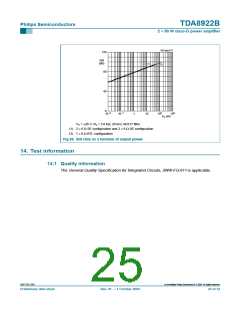
2 × 50 W class-D power amplifier
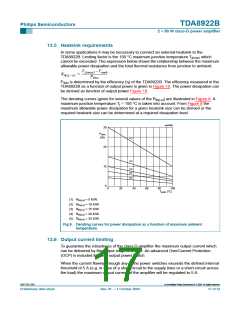
13.9 Curves measured in reference design
001aab199
001aab200
2
2
10
10
(THD + N)/S
(THD + N)/S
(%)
(%)
10
1
10
1
(1)
(2)
(3)
(1)
(2)
−1
−1
10
10
(3)
−2
−2
10
10
−3
−3
10
10
−2
−1
2
3
−2
−1
2
10
10
1
10
10
10
(W)
10
10
1
10
10
P
P (W)
o
o
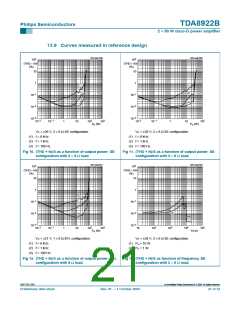
VP = ±26 V; 2 × 6 Ω SE configuration.
(1) f = 6 kHz.
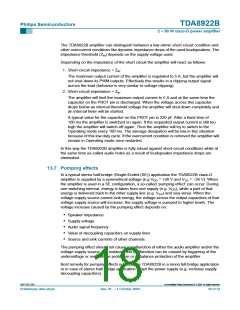
VP = ±26 V; 2 × 8 Ω SE configuration.
(1) f = 6 kHz.
(2) f = 1 kHz.
(3) f = 100 Hz.
(2) f = 1 kHz.
(3) f = 100 Hz.
Fig 10. (THD + N)/S as a function of output power; SE
Fig 11. (THD + N)/S as a function of output power; SE
configuration with 2 × 6 Ω load.
configuration with 2 × 8 Ω load.
001aab201
001aab202
2
2
10
10
(THD + N)/S
(THD + N)/S
(%)
(%)
10
10
1
1
(1)
−1
−1
10
10
(1)
(2)
−2
−2
(2)
10
(3)
10
10
−3
−3
10
−2
−1
2
3
2
3
4
5
10
10
1
10
10
10
(W)
10
10
10
10
10
P
f (Hz)
o
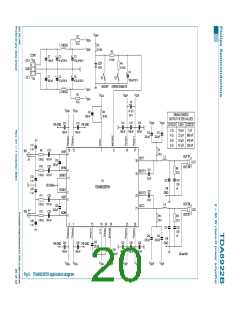
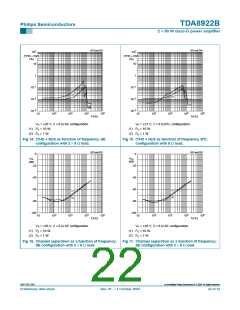
VP = ±21 V; 1 × 8 Ω BTL configuration.
VP = ±26 V; 2 × 6 Ω SE configuration.
(1) f = 6 kHz.
(2) f = 1 kHz.
(3) f = 100 Hz.
(1) Po = 10 W.
(2) Po = 1 W.
Fig 12. (THD + N)/S as a function of output power; BTL
Fig 13. (THD + N)/S as function of frequency, SE
configuration with 8 Ω load.
configuration with 2 × 6 Ω load.
9397 750 13357
© Koninklijke Philips Electronics N.V. 2004. All rights reserved.
Preliminary data sheet
Rev. 01 — 1 October 2004
21 of 32

 NXP [ NXP ]