NCP1252
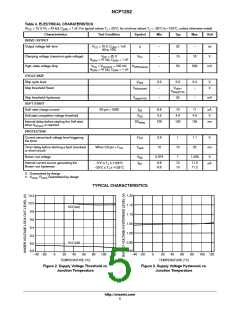
TYPICAL CHARACTERISTICS
50
40
30
20
5
4
3
2
10
0
1
0
−40 −20
0
20
40
60
80
100 120
−40 −20
0
20
40
60
80
100 120
TEMPERATURE (°C)
TEMPERATURE (°C)
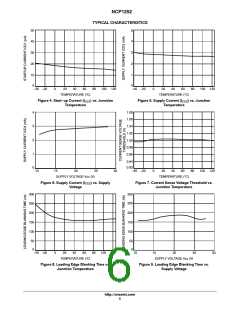
Figure 4. Start−up Current (ICC1) vs. Junction
Figure 5. Supply Current (ICC3) vs. Junction
Temperature
Temperature
4
3
2
1.08
1.06
1.04
1.02
1.00
0.98
0.96
1
0
0.94
0.92
10
15
20
25
30
−40 −20
0
20
40
60
80
100 120
SUPPLY VOLTAGE Vcc (V)
TEMPERATURE (°C)
Figure 6. Supply Current (ICC3) vs. Supply
Voltage
Figure 7. Current Sense Voltage Threshold vs.
Junction Temperature
300
250
200
150
100
300
250
200
150
100
50
0
50
0
−40 −20
0
20
40
60
80
100 120
10
15
20
25
30
TEMPERATURE (°C)
SUPPLY VOLTAGE Vcc (V)
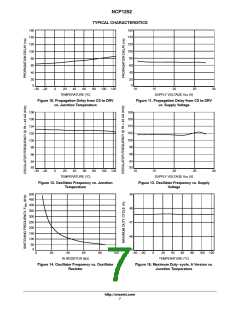
Figure 8. Leading Edge Blanking Time vs.
Junction Temperature
Figure 9. Leading Edge Blanking Time vs.
Supply Voltage
http://onsemi.com
6

 ONSEMI [ ONSEMI ]