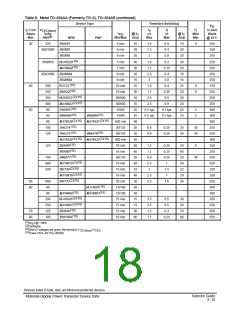
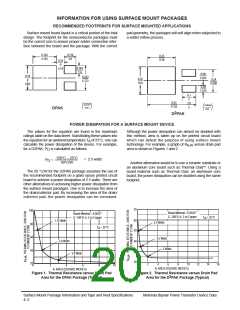
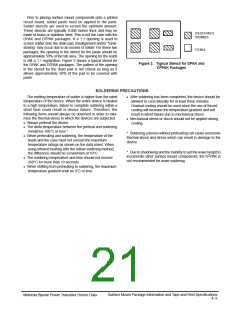
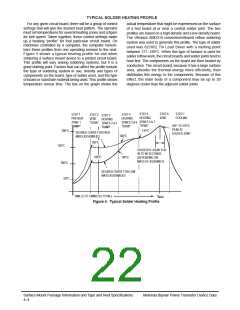
TYPICAL SOLDER HEATING PROFILE
For any given circuit board, there will be a group of control
actual temperature that might be experienced on the surface
of a test board at or near a central solder joint. The two
profiles are based on a high density and a low density board.
The Vitronics SMD310 convection/infrared reflow soldering
system was used to generate this profile. The type of solder
used was 62/36/2 Tin Lead Silver with a melting point
between 177–189°C. When this type of furnace is used for
solder reflow work, the circuit boards and solder joints tend to
heat first. The components on the board are then heated by
conduction. The circuit board, because it has a large surface
area, absorbs the thermal energy more efficiently, then
distributes this energy to the components. Because of this
effect, the main body of a component may be up to 30
degrees cooler than the adjacent solder joints.
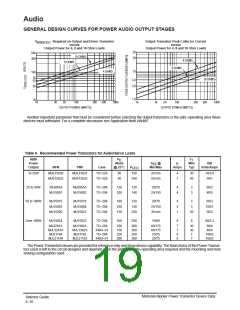
settings that will give the desired heat pattern. The operator
must set temperatures for several heating zones and a figure
for belt speed. Taken together, these control settings make
up a heating “profile” for that particular circuit board. On
machines controlled by a computer, the computer remem-
bers these profiles from one operating session to the next.
Figure 5 shows a typical heating profile for use when
soldering a surface mount device to a printed circuit board.
This profile will vary among soldering systems, but it is a
good starting point. Factors that can affect the profile include
the type of soldering system in use, density and types of
components on the board, type of solder used, and the type
of board or substrate material being used. This profile shows
temperature versus time. The line on the graph shows the
STEP 5
STEP 6
VENT
STEP 7
COOLING
STEP 1
STEP 4
STEP 2
VENT
“SOAK”
STEP 3
HEATING
ZONES 4 & 7
“SPIKE”
PREHEAT
ZONE 1
“RAMP”
HEATING
ZONES 3 & 6
“SOAK”
HEATING
ZONES 2 & 5
“RAMP”
205° TO 219°C
PEAK AT
SOLDER JOINT
200°C
170°C
DESIRED CURVE FOR HIGH
MASS ASSEMBLIES
160°C
150°C
150°C
SOLDER IS LIQUID FOR
40 TO 80 SECONDS
(DEPENDING ON
100°C
140°C
MASS OF ASSEMBLY)
100°C
DESIRED CURVE FOR LOW
MASS ASSEMBLIES
50°C
TIME (3 TO 7 MINUTES TOTAL)
T
MAX
Figure 4. Typical Solder Heating Profile
Surface Mount Package Information and Tape and Reel Specifications
4–4
Motorola Bipolar Power Transistor Device Data

 ONSEMI [ ONSEMI ]