LTC1278
U
W U U
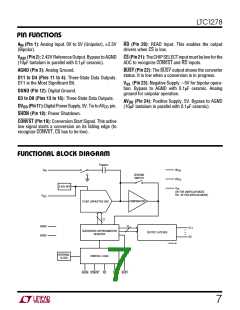
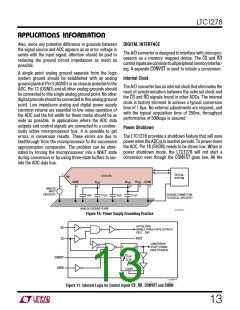
APPLICATIONS INFORMATION
compare mode. The input switch switches CSAMPLE to
ground, injecting the analog input charge onto the sum-
ming junction. This input charge is successively com-
pared with the binary-weighted charges supplied by the
capacitive DAC. Bit decisions are made by the high speed
comparator. At the end of a conversion, the DAC output
balances the AIN input charge. The SAR contents (a 12-bit
data word) which represent the AIN are loaded into the
12-bit output latches.
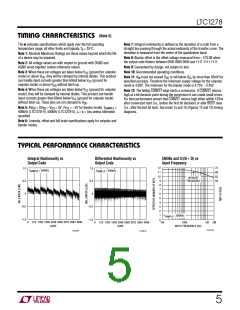
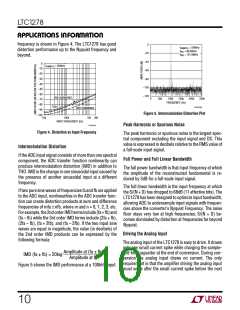
a 500kHz sampling rate and a 100kHz input. The dynamic
performance is excellent for input frequencies up to the
Nyquist limit of 250kHz.
Effective Number of Bits
TheEffectiveNumberofBits(ENOBs)isameasurementof
the resolution of an ADC and is directly related to the
S/(N + D) by the equation:
N = [S/(N + D) – 1.76]/6.02
DYNAMIC PERFORMANCE
where N is the Effective Number of Bits of resolution and
S/(N + D) is expressed in dB. At the maximum sampling
rateof500kHztheLTC1278maintainsverygoodENOBsup
to the Nyquist input frequency of 250kHz. Refer to Figure 3.
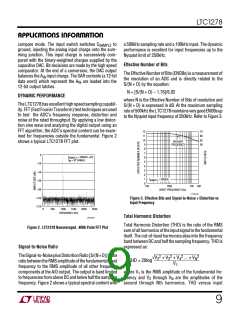
TheLTC1278 has excellent highspeedsampling capabil-
ity.FFT(FastFourierTransform)testtechniquesareused
to test the ADC’s frequency response, distortion and
noise at the rated throughput. By applying a low distor-
tion sine wave and analyzing the digital output using an
FFT algorithm, the ADC’s spectral content can be exam-
ined for frequencies outside the fundamental. Figure 2
shows a typical LTC1278 FFT plot.
12
11
10
9
74
68
62
56
NYQUIST
FREQUENCY
8
7
0
f
f
= 500kHz ±5V
6
SAMPLE
IN
= 97.045kHz
5
–20
4
3
–40
–60
2
1
f
= 500kHz
SAMPLE
0
10k
100k
INPUT FREQUENCY (Hz)
1M 2M
–80
–100
–120
LT1278 G4
Figure 3. Effective Bits and Signal-to-Noise + Distortion vs
Input Frequency
0
50k
100k
150k
200k
250k
FREQUENCY (Hz)
Total Harmonic Distortion
LTC1278 F2
Total Harmonic Distortion (THD) is the ratio of the RMS
sumofallharmonicsoftheinputsignaltothefundamental
itself. The out-of-band harmonics alias into the frequency
band between DC and half the sampling frequency. THD is
expressed as:
Figure 2. LTC1278 Nonaveraged, 4096 Point FFT Plot
Signal-to-Noise Ratio
TheSignal-to-NoiseplusDistortionRatio[S/(N+D)]isthe
ratiobetweentheRMSamplitudeofthefundamentalinput
frequency to the RMS amplitude of all other frequency
components at the A/D output. The output is band limited
tofrequenciesfromaboveDCandbelowhalfthesampling
frequency. Figure 2 shows a typical spectral content with
2
2
2
2
√V2 + V3 + V4 ... + VN
THD = 20log
V1
where V1 is the RMS amplitude of the fundamental fre-
quency and V2 through VN are the amplitudes of the
second through Nth harmonics. THD versus input
9

 Linear [ Linear ]