HA-2420, HA-2425
EADT may be positive, negative or zero. If zero, the S/H ampli-
Glossary of Terms
fier will output a voltage equal to V at the instant the Hold
IN
Acquisition Time
command was received. For negative EADT, the output in Hold
(exclusive of pedestal and droop errors) will correspond to a
The time required following a “sample” command, for the output
to reach its final value within ±0.1% or ±0.01%. This is the mini-
mum sample time required to obtain a given accuracy, and
includes switch delay time, slewing time and settling time.
value of V that occurred before the Hold command.
IN
Aperture Uncertainty
The range of variation in Effective Aperture Delay Time. Aper-
ture Uncertainty (also called Aperture Delay Uncertainty,
Aperture Time Jitter, etc.) sets a limit on the accuracy with
which a waveform can be reconstructed from sample data.
Aperture Time
The time required for the sample-and-hold switch to open,
independent of delays through the switch driver and input
amplifier circuitry. The switch opening time is that interval
between the conditions of 10% open and 90% open.
Drift Current
The net leakage current from the hold capacitor during the
hold mode. Drift current can be calculated from the droop
rate using the formula:
Effective Aperture Delay Time (EADT)
The difference between the digital delay time from the Hold
command to the opening of the S/H switch, and the propaga-
tion time from the analog input to the switch.
∆V
∆t
-------
I
(pA) = C (pF) ×
(V ⁄ s)
D
H
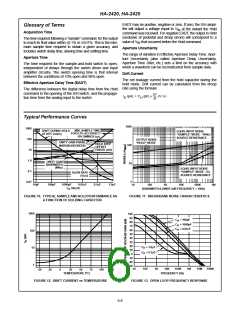
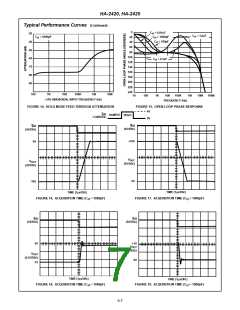
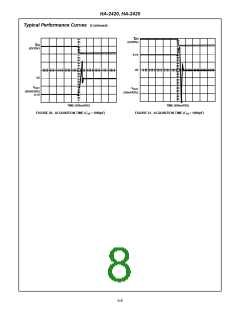
Typical Performance Curves
1000
1000
MIN. SAMPLE TIME
FOR 0.1% ACCURACY
10V SWINGS (µs)
DRIFT DURING HOLD
AT 25 C (mV/s)
EQUIV. INPUT NOISE
o
“SAMPLE” MODE - 100kΩ
SOURCE RESISTANCE
100
10
OUTPUT NOISE
“HOLD” MODE
UNITY GAIN PHASE
MARGIN (DEGREES)
HOLD STEP
OFFSET
100
10
1
ERROR (mV)
1.0
UNITY GAIN
BANDWIDTH
(MHz)
EQUIV. INPUT NOISE
“SAMPLE” MODE - 0Ω
SOURCE RESISTANCE
0.1
SLEW RATE
(V/µs)
0.01
10pF
100pF
1000pF
0.01µF
0.1µF
1.0µF
10
100
1K
10K
100K
1M
C
VALUE
H
BANDWIDTH (LOWER 3dB FREQUENCY = 10Hz)
FIGURE 10. TYPICAL SAMPLE AND HOLD PERFORMANCE AS
A FUNCTION OF HOLDING CAPACITOR
FIGURE 11. BROADBAND NOISE CHARACTERISTICS
1000
100
10
100
90
80
70
60
50
40
30
20
10
0
C
C
C
= 100pF
= 1000pF
= 0.01µF
H
H
H
C
C
= 1.0µF
= 0.1µF
H
H
-10
-20
-30
1
10
100
1K
10K
100K
1M
10M
100M
-50
-25
0
25
50
75
100
125
o
TEMPERATURE ( C)
FREQUENCY (Hz)
FIGURE 12. DRIFT CURRENT vs TEMPERATURE
FIGURE 13. OPEN LOOP FREQUENCY RESPONSE
5-6

 INTERSIL [ Intersil ]