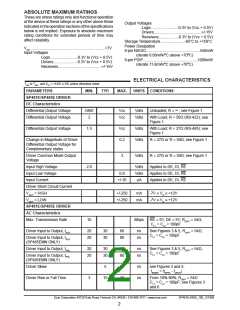
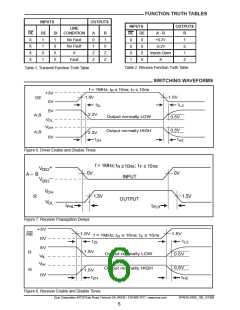
FUNCTION TRUTH TABLES
INPUTS
OUTPUTS
INPUTS
OUTPUTS
LINE
RE
X
DE
ꢀ
DI
CONDITION
A
0
ꢀ
Z
Z
B
ꢀ
0
Z
Z
RE
0
DE
A - B
+0.2V
R
ꢀ
0
ꢀ
Z
ꢀ
0
No Fault
No Fault
X
0
0
0
0
X
ꢀ
0
-0.2V
X
0
X
X
0
Inputs Open
X
X
ꢀ
Fault
ꢀ
Table 2. Receive Function Truth Table
Table 1. Transmit Function Truth Table
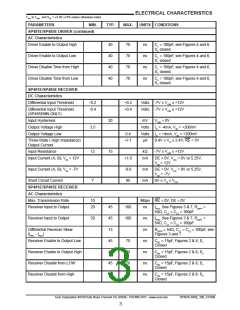
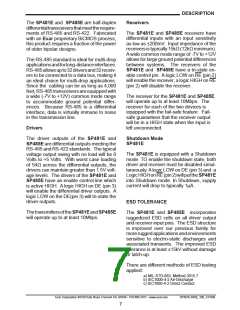
SWITCHING WAVEFORMS
f = 1MHz; t < 10ns; t < 10ns
R
F
+3V
1.5V
1.5V
DE
A,B
A,B
0V
5V
t
t
LZ
ZL
2.3V
Output normally LOW
Output normally HIGH
0.5V
0.5V
V
OL
V
OH
2.3V
0V
t
t
HZ
ZH
Figure 6. Driver Enable and Disable Times
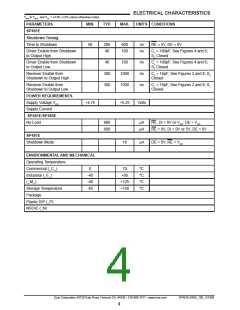
f = 1MHz; t
1.5V
; t
≤ 10ns
F
≤10ns
R
+
–
V
OD2
0V
0V
A – B
R
INPUT
V
OD2
V
OH
1.5V
OUTPUT
V
OL
t
t
PHL
PLH
Figure 7. Receiver Propagation Delays
+3V
1.5V
1.5V
RE
R
f = 1MHz; t ≤ 10ns; t ≤ 10ns
R
F
0V
5V
t
t
LZ
ZL
1.5V
Output normally LOW
Output normally HIGH
0.5V
0.5V
V
IL
V
IH
R
1.5V
0V
t
t
HZ
ZH
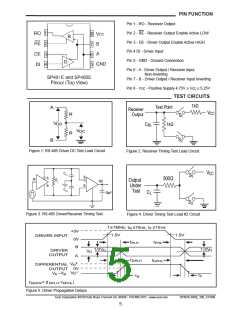
Figure 8. Receiver Enable and Disable Times
Exar Corporation 48720 Kato Road, Fremont CA, 94538 • 5ꢀ0-668-70ꢀ7 • www.exar.com
SP48ꢀE,485E_ꢀ00_ꢀ2ꢀ808
6

 EXAR [ EXAR CORPORATION ]