LX1992
High Efficiency LED Driver
L I N F I N I T Y D I V I S I O N
PRODUCTION
CHARACTERISTIC CURVES
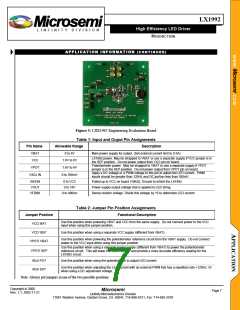
Figure 6: VOUT and Inductor Current Waveforms.
Channel 1: VOUT (AC coupled; 100mV/div)
Figure 5: VOUT and Inductor Current Waveforms.
Channel 1: VOUT (AC coupled; 200mV/div)
Channel 2: Inductor Current (100mA/div.)
Channel 2: Inductor Current (100mA/div.)
Configuration: VIN = 3.0V, VOUT = 13.7V, IIN = 120mA
Configuration: VIN = 3.0V, VOUT = 13.0V, IIN = 65mA
90%
80%
70%
60%
50%
5
4
3
2
1
0
0
20
40
60
80
100
120
140
160
0
2
4
6
8
10
12
14
16
18
Drive Current (mA)
LED Current (mA)
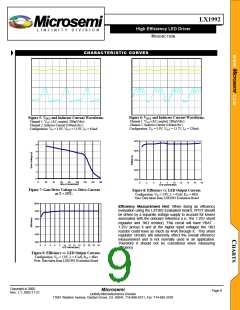
Figure 7: Gate Drive Voltage vs. Drive Current
at T = 25oC.
Figure 8: Efficiency vs. LED Output Current.
Configuration: VIN = 3.0V, L = 47µH, RCS = 4KΩ
Note: Data taken from LXE1992 Evaluation Board
100%
90%
80%
70%
60%
50%
Efficiency Measurement Hint: When doing an efficiency
evaluation using the LX1992 Evaluation Board, VPOT should
be driven by a separate voltage supply to account for losses
associated with the onboard reference (i.e., the 1.25V shunt
regulator and 1KΩ resistor). This circuit will have VBAT -
1.25V across it and at the higher input voltages the 1KΩ
resistor could have as much as 4mA through it. This shunt
regulator circuitry will adversely effect the overall efficiency
measurement and is not normally used in an application.
Therefore it should not be considered when measuring
efficiency.
0
2
4
6
8
10 12 14 16 18 20 22 24
LED Current (mA)
Figure 9: Efficiency vs. LED Output Current.
Configuration: VIN = 5.0V, L = 47µH, RCS = 4KΩ
Note: Data taken from LXE1992 Evaluation Board
Copyright 2000
Rev. 1.1, 2002-11-21
Microsemi
Page 9
Linfinity Microelectronics Division
11861 Western Avenue, Garden Grove, CA. 92841, 714-898-8121, Fax: 714-893-2570

 ETC [ ETC ]