TPS5430
www.ti.com
SLVS632–JANUARY 2006
PERFORMANCE GRAPHS
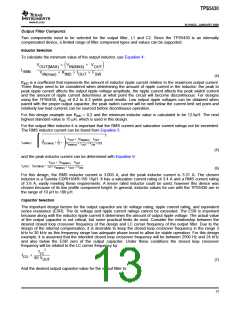
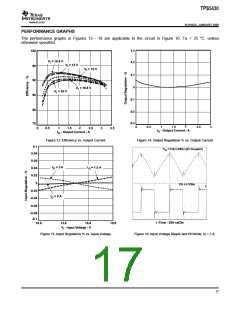
The performance graphs in Figures 12 - 18 are applicable to the circuit in Figure 10. Ta = 25 °C. unless
otherwise specified.
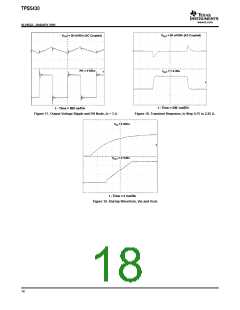
0.3
100
V = 10.8 V
I
0.2
V = 12 V
I
95
V = 15 V
I
0.1
90
0
V = 19.8 V
I
V = 18 V
I
85
-0.1
80
-0.2
-0.3
75
2
0
0.5
1
1.5
2.5
3
0
0.5
1
1.5
2
2.5
3
3.5
I
- Output Current - A
O
I
- Output Current - A
O
Figure 13. Efficiency vs. Output Current
Figure 14. Output Regulation % vs. Output Current
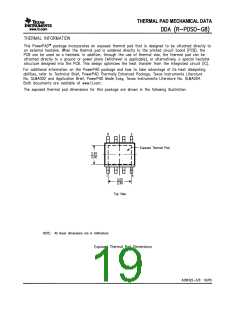
0.1
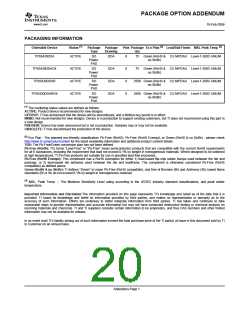
V
IN
= 100 mV/Div (AC Coupled)
0.08
0.06
0.04
0.02
I
= 3 A
I
= 1.5 A
O
O
0
-0.02
-0.04
-0.06
PH = 5 V/Div
I
= 0 A
O
-0.08
-0.1
t -Time - 500 ns/Div
10.8
13.8
16.8
19.8
V - Input Voltage - V
I
Figure 15. Input Regulation % vs. Input Voltage
Figure 16. Input Voltage Ripple and PH Node, Io = 3 A.
17

 TI [ TEXAS INSTRUMENTS ]