TMP112
SBOS473B–MARCH 2009–REVISED JUNE 2009 ......................................................................................................................................................... www.ti.com
CALIBRATING FOR IMPROVED ACCURACY
There are many temperature monitoring applications that require better than 0.5°C accuracy over a limited
temperature range. Knowing the offset of a temperature sensor at a given temperature in conjunction with the
average temperature span (slope) error over a fixed range makes it possible to achieve this improved accuracy.
The TMP112 has three distinct slope regions that conservatively approximate its inherent curvature:
1. Slope1 applies over –40°C to +25°C
2. Slope2 applies over +25°C to +85°C
3. Slope3 applies over +85°C to +125°C
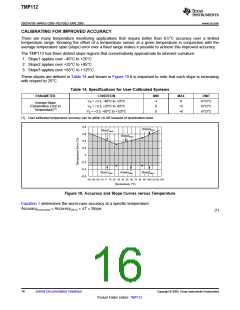
These slopes are defined in Table 14 and shown in Figure 19.It is important to note that each slope is increasing
with respect to 25°C.
Table 14. Specifications for User-Calibrated Systems
PARAMETER
CONDITION
MIN
–7
0
MAX
0
UNIT
VS = +3.3, –40°C to +25°C
VS = +3.3, +25°C to +85°C
VS = +3.3, +85°C to +125°C
m°C/°C
m°C/°C
m°C/°C
Average Slope
(Temperature Error vs
Temperature)(1)
+5
0
+8
(1) User-calibrated temperature accuracy can be within ±1LSB because of quantization noise.
0.8
Slope3MAX
Slope1MAX
0.6
Slope2MAX
0.4
0.2
0
-0.2
-0.4
Slope1MIN
Slope2MIN
Slope3MIN
-0.6
-40-30 -20 -10
0
10 20 30 40 50 60 70 80 90 100 110120 130
Temperature (°C)
Figure 19. Accuracy and Slope Curves versus Temperature
Equation 1 determines the worst-case accuracy at a specific temperature:
Accuracy(worst-case) = Accuracy(25°C) + DT ´ Slope
(1)
16
Submit Documentation Feedback
Copyright © 2009, Texas Instruments Incorporated
Product Folder Link(s): TMP112

 TI [ TEXAS INSTRUMENTS ]