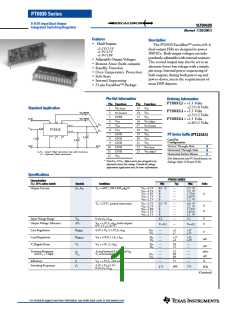
PT6930 Series
8-A 5V-Input Dual-Output
Integrated Switching Regulator
Specifications (From previous page)
PT6930 SERIES
Typ
Characteristics
(Ta= 25°C unless noted)
Symbols
Conditions
Min
Max
Units
Absolute Maximum
Ta
—
—
-40 (3)
—
+85 (4)
°C
Operating Temperature Range
Storage Temperature
Weight
Ts
—
-40
—
—
29
+125
—
°C
Vertical/Horizontal
grams
Notes: (1) Iomin current of 0.1A can be divided btween both outputs; Vo1, or Vo2. The ISR will operate down to no-load with reduced specifications.
(2) Iomax listed for each output assumes the maximum current drawn simultaneously on both outputs. Consult the factory for the absolute maximum.
(3) For operating temperatures below 0°C, use tantalum type capacitors at both the input and output.
(4) See Safe Operating Area curves for appropriate derating.
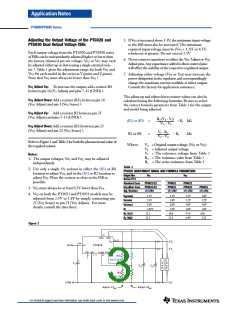
Input/Output Capacitors: The PT6930 series requires a minimumm capacitance of 330µF at both the input and Vo1 output for proper operation in all applications. In addition,
the input capacitor, C1, must be rated for a minimum of 1.0Arms ripple current. For transient or dynamic dynamic loads, additional capacitance may be required.
T Y P I C A L
C H A R A C T E R I S T I C S
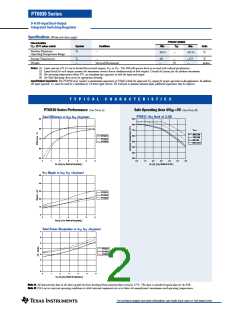
Safe Operating Area @VIN =5V (See Note B)
PT6930 Series Performance (See Note A)
PT6931 (Io2 fixed at 2.2A)
Total Efficiency vs Io1; Io2 =Io2(max)
90
80
70
60
50
90.0
80.0
70.0
60.0
50.0
40.0
30.0
20.0
VOUT
200LFM
120LFM
60LFM
PT6931
PT6932
PT6933
Nat conv
0
1
2
3
4
5
6
0.0
1.0
2.0
3.0
4.0
5.0
6.0
Io1 (A) [ Io2 fixed at Io2(max) ]
Io1 (A) [ Io2 fixed at 2.2A ]
Vo1 Ripple vs Io1; Io2 =Io2(max)
50
40
30
20
10
0
PT6931
PT6932
PT6933
0
1
2
3
4
5
6
Io1(A) [ Io2 fixed at Io2(max) ]
Total Power Dissipation vs Io1; Io2 =Io2(max)
7
6
5
4
3
2
1
0
PT6931
PT6932
PT6933
0
1
2
3
4
5
6
Io1 (A) [ Io2 fixed at Io2(max) ]
Note A: All characteristic data in the above graphs has been developed from actual products tested at 25°C. This data is considered typical data for the ISR.
Note B: SOA curves represent operating conditions at which internal components are at or below the manufactuer’s maximum rated operating temperatures.
For technical support and more information, see inside back cover or visit www.ti.com

 TI [ TEXAS INSTRUMENTS ]