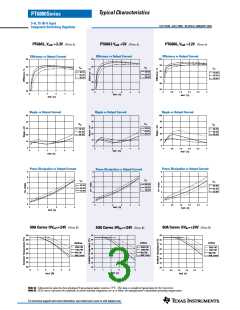
Typical Characteristics
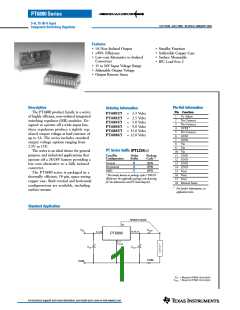
PT6880Series
5-A, 15-36-V Input
Integrated Switching Regulator
SLTS103B -JULY 2000 - REVISED JANUARY 2003
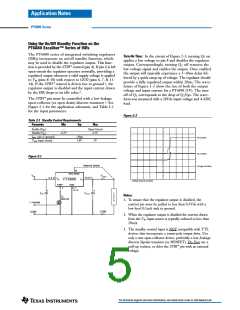
PT6883 Vout =5V (Note A)
PT6886, Vout =12V (Note A)
PT6881, Vout =3.3V (Note A)
Efficiency vs Output Current
Efficiency vs Output Current
Efficiency vs Output Current
90
80
70
60
50
90
80
70
60
50
100
90
80
70
60
50
VIN
VIN
VIN
18.0V
24.0V
36.0V
18.0V
24.0V
36.0V
18.0V
24.0V
36.0V
0
0.8
1.6
2.4
3.2
4
0
1
2
3
4
5
0
1
2
3
4
5
Iout - (A)
Iout - (A)
Iout (A)
Ripple vs Output Current
Ripple vs Output Current
Ripple vs Output Current
50
40
30
20
10
0
50
40
30
20
10
0
100
80
60
40
20
0
VIN
VIN
VIN
18.0V
24.0V
36.0V
18.0V
24.0V
36.0V
36.0V
24.0V
18.0V
0
0.8
1.6
2.4
3.2
4
0
1
2
3
4
5
0
1
2
3
4
5
Iout - (A)
Iout - (A)
Iout (A)
Power Dissipation vs Output Current
Power Dissipation vs Output Current
Power Dissipation vs Output Current
6
5
4
3
2
1
0
6
5
4
3
2
1
0
6
5
4
3
2
1
0
VIN
VIN
VIN
36.0V
24.0V
18.0V
36.0V
24.0V
18.0V
36.0V
24.0V
18.0V
0
1
2
3
4
5
0
0.8
1.6
2.4
3.2
4
0
1
2
3
4
5
Iout - (A)
Iout - (A)
Iout (A)
SOA Curves @Vin=+24V (Note B)
SOA Curves @Vin=+24V (Note B)
SOA Curves @Vin=+24V (Note B)
90
80
70
60
50
40
30
20
90
80
70
60
50
40
30
20
90
80
70
60
50
40
30
20
Airflow
Airflow
Airflow
200LFM
120LFM
60LFM
200LFM
120LFM
60LFM
200LFM
120LFM
60LFM
Nat Conv
Nat Conv
Nat Conv
0
1
2
3
4
5
0
1
2
3
4
5
0
0.8
1.6
2.4
3.2
4
Iout (A)
Iout (A)
Iout (A)
Note A: Characteristic data has been developed from actual products tested at 25°C. This data is considered typical data for the Converter.
Note B: SOA curves represent the conditions at which internal components are at or below the manufacturer’s maximum operating temperatures
For technical support and more information, see inside back cover or visit www.ti.com

 TI [ TEXAS INSTRUMENTS ]