Typical Characteristics
PT4560 Series
30-W 48-V Input
Isolated DC/DC Converter
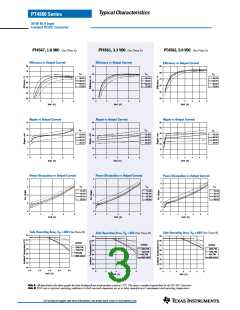
PT4567, 1.8 VDC (See Note A)
PT4561, 3.3 VDC (See Note A)
PT4562, 5.0 VDC (See Note A)
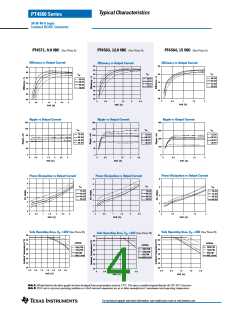
Efficiency vs Output Current
Efficiency vs Output Current
Efficiency vs Output Current
80
75
70
65
60
55
50
90
80
70
60
50
90
80
70
60
50
40
VIN
VIN
VIN
36.0V
48.0V
60.0V
75.0V
48.0V
48.0V
60.0V
36.0V
75.0V
36.0V
60.0V
75.0V
0
2
4
6
8
0
2
4
6
8
0
1
2
3
4
5
6
Iout (A)
Iout (A)
Iout (A)
Ripple vs Output Current
Ripple vs Output Current
Ripple vs Output Current
20
16
12
8
50
40
30
20
10
0
60
50
40
30
20
10
0
VIN
VIN
VIN
75.0V
60.0V
48.0V
36.0V
75.0V
60.0V
48.0V
36.0V
75.0V
60.0V
48.0V
36.0V
4
0
0
2
4
6
8
0
2
4
6
8
0
1
2
3
4
5
6
Iout (A)
Iout (A)
Iout (A)
Power Dissipation vs Output Current
Power Dissipation vs Output Current
Power Dissipation vs Output Current
8
6
4
2
0
8
6
4
2
0
7
6
5
4
3
2
1
0
VIN
VIN
VIN
75.0V
60.0V
48.0V
36.0V
75.0V
60.0V
36.0V
48.0V
75.0V
36.0V
60.0V
48.0V
0
2
4
6
8
0
2
4
6
8
0
1
2
3
4
5
6
Iout (A)
Iout (A)
Iout (A)
Safe Operating Area, Vin =48V (See Note B)
Safe Operating Area, Vin =48V (See Note B)
Safe Operating Area, Vin =48V (See Note B)
90
80
70
60
50
40
30
20
90
80
70
60
50
40
30
20
90
80
70
60
50
40
30
20
Airflow
Airflow
Airflow
200LFM
120LFM
60LFM
200LFM
120LFM
60LFM
200LFM
120LFM
60LFM
Nat Conv
Nat conv
Nat conv
0.0
2.0
4.0
6.0
8.0
0
2
4
6
8
0
1
2
3
4
5
6
Iout (A)
Iout (A)
Iout (A)
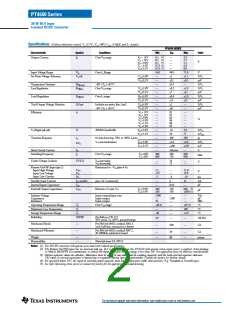
Note A: All data listed in the above graphs has been developed from actual products tested at 25°C. This data is considered typical data for the DC-DC Converter.
Note B: SOA curves represent operating conditions at which internal components are at or below manufacturer’s maximum rated operating temperature.
For technical support and more information, see inside back cover or visit www.ti.com

 TI [ TEXAS INSTRUMENTS ]