PGA281
SBOS664A –MARCH 2013–REVISED JUNE 2013
www.ti.com
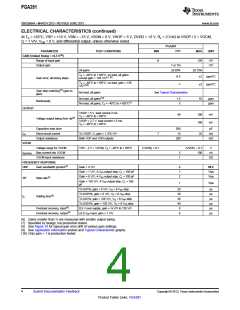
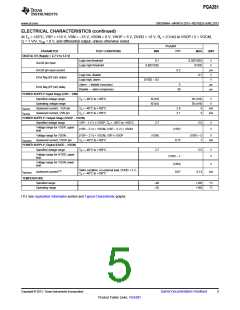
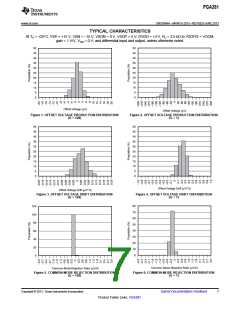
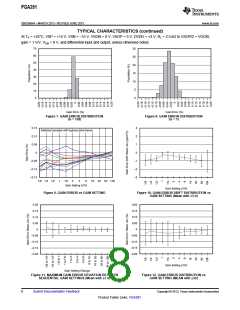
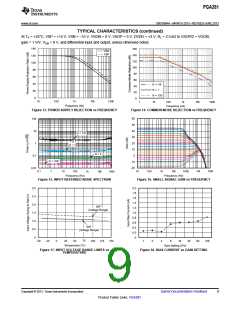
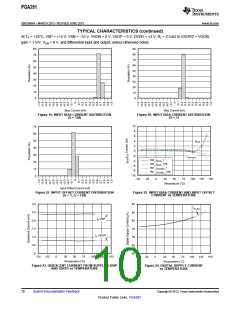
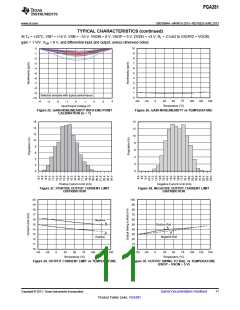
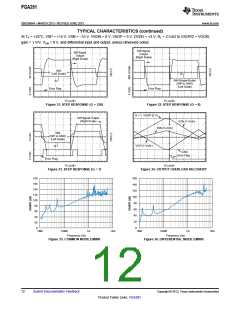
TYPICAL CHARACTERISTICS (continued)
At TA = +25°C, VSP = +15 V, VSN = –15 V, VSON = 0 V, VSOP = 5 V, DVDD = +3 V, RL = 2.5 kΩ to VSOP/2 = VOCM,
gain = 1 V/V, VCM = 0 V, and differential input and output, unless otherwise noted.
30
25
20
15
10
5
70
60
50
40
30
20
10
0
0
Gain Error (%)
Gain Error (%)
Figure 7. GAIN ERROR DISTRIBUTION
(G = 128)
Figure 8. GAIN ERROR DISTRIBUTION
(G = 1)
0.15
0.10
0.05
0
3
2
1
0
Selected samples with typical performance
-0.05
-0.10
-0.15
-1
-2
-3
1
13
8
2
4
8
16 32 64 128
1/8 1/4 1/2
Gain Setting (V/V)
Gain Setting (V/V)
Figure 9. GAIN ERROR vs GAIN SETTING
Figure 10. GAIN ERROR DRIFT DISTRIBUTION vs
GAIN SETTING (Mean with ±3 σ)
0.20
0.20
0.15
0.10
0.05
0
0.15
0.10
0.05
0
-0.05
-0.10
-0.15
-0.20
-0.05
-0.10
-0.15
-0.20
Gain Setting (V/V)
Gain Setting Change
Figure 11. MAXIMUM GAIN ERROR DEVIATION BETWEEN
Figure 12. GAIN ERROR DISTRIBUTION vs
SEQUENTIAL GAIN SETTINGS (Mean with ±3 σ)
GAIN SETTING (MEAN with ±3σ)
8
Submit Documentation Feedback
Copyright © 2013, Texas Instruments Incorporated
Product Folder Links: PGA281

 TI [ TEXAS INSTRUMENTS ]