ADS1291
ADS1292
ADS1292R
www.ti.com
SBAS502A –DECEMBER 2011–REVISED MARCH 2012
PARAMETER MEASUREMENT INFORMATION
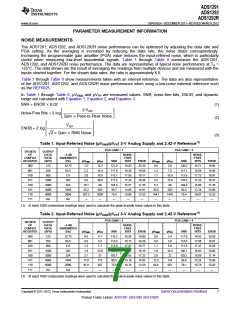
NOISE MEASUREMENTS
The ADS1291, ADS1292, and ADS1292R noise performance can be optimized by adjusting the data rate and
PGA setting. As the averaging is increased by reducing the data rate, the noise drops correspondingly.
Increasing the programmable gain amplifier (PGA) value reduces the input-referred noise, which is particularly
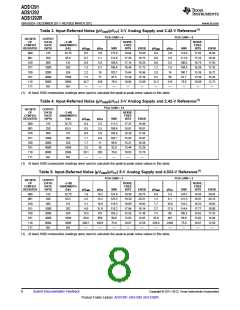
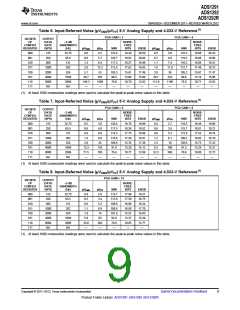
useful when measuring low-level biopotential signals. Table 1 through Table 8 summarize the ADS1291,
ADS1292, and ADS1292R noise performance. The data are representative of typical noise performance at TA =
+25°C. The data shown are the result of averaging the readings from multiple devices and are measured with the
inputs shorted together. For the shown data rates, the ratio is approximately 6.6.
Table 1 through Table 8 show measurements taken with an internal reference. The data are also representative
of the ADS1291, ADS1292, and ADS1292R noise performance when using a low-noise external reference such
as the REF5025.
In Table 1 through Table 8, µVRMS and µVPP are measured values. SNR, noise-free bits, ENOB, and dynamic
range are calculated with Equation 1, Equation 2, and Equation 3.
SNR = ENOB ´ 6.02
(1)
2 VREF
Noise-Free Bits = 2 log
Gain ´ Peak-to-Peak Noise
(2)
VREF
ENOB = 2 log
2 ´ Gain ´ RMS Noise
(3)
Table 1. Input-Referred Noise (μVRMS/μVPP) 3-V Analog Supply and 2.42-V Reference(1)
PGA GAIN = 1
PGA GAIN = 2
DR BITS
OF
CONFIG1
REGISTER
OUTPUT
DATA
RATE
–3-dB
BANDWIDTH
(Hz)
NOISE-
FREE
BITS
NOISE-
FREE
BITS
(SPS)
μVRMS
1.5
μVPP
10.3
14.4
18.9
30.8
99
SNR
121.0
117.8
115.1
111.3
104.5
89.7
ENOB
20.10
19.58
19.11
18.49
17.36
14.91
12.53
—
μVRMS
0.8
μVPP
5.6
SNR
120.0
117.1
113.9
110.6
104.0
90.3
ENOB
19.94
19.46
18.91
18.37
17.28
15.00
12.52
—
000
001
010
011
100
101
110
111
125
250
32.75
65.5
131
18.83
18.34
17.95
17.25
15.57
13.06
10.68
—
18.71
18.29
17.75
17.23
15.60
13.14
10.67
—
2.2
1.2
7.5
500
3.0
1.7
10.9
15.6
48
1000
2000
4000
8000
NA
262
4.6
2.5
524
10.1
55.2
287.3
—
5.3
1048
2096
NA
563
2930
—
26.0
144.1
—
265
1470
—
75.4
75.4
—
—
(1) At least 1000 consecutive readings were used to calculate the peak-to-peak noise values in this table.
Table 2. Input-Referred Noise (μVRMS/μVPP) 3-V Analog Supply and 2.42-V Reference(1)
PGA GAIN = 3
PGA GAIN = 4
DR BITS
OF
CONFIG1
REGISTER
OUTPUT
DATA
RATE
–3-dB
BANDWIDTH
(Hz)
NOISE-
FREE
BITS
NOISE-
FREE
BITS
(SPS)
μVRMS
0.6
μVPP
4.1
SNR
119.2
115.9
113.0
109.5
103.7
90.5
ENOB
19.80
19.26
18.77
18.19
17.23
15.03
12.59
—
μVRMS
0.5
μVPP
3.4
SNR
117.9
114.8
111.9
108.7
103.2
90.8
ENOB
19.58
19.07
18.59
18.06
17.14
15.09
12.63
—
000
001
010
011
100
101
110
111
125
250
32.75
65.5
131
18.58
18.15
17.67
17.02
15.65
13.18
10.74
—
18.42
17.88
17.47
16.83
15.69
13.24
10.78
—
0.9
5.5
0.8
5.0
500
1.3
7.7
1.1
6.6
1000
2000
4000
8000
NA
262
1.9
12.0
31
1.6
10.3
23
524
3.7
2.9
1048
2096
NA
17.0
91.9
—
173
937
—
12.2
66.8
—
124
681
—
75.8
76.1
—
—
(1) At least 1000 consecutive readings were used to calculate the peak-to-peak noise values in this table.
Copyright © 2011–2012, Texas Instruments Incorporated
Submit Documentation Feedback
7
Product Folder Link(s): ADS1291 ADS1292 ADS1292R

 TI [ TEXAS INSTRUMENTS ]