Characteristics
STTH1212
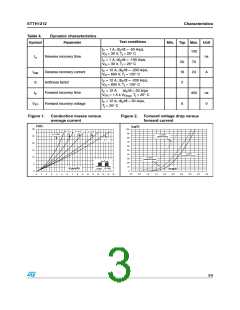
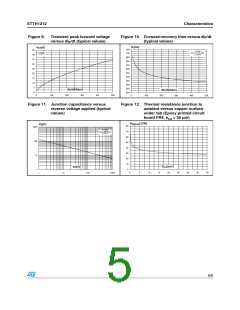
Figure 3.
Relative variation of thermal
Figure 4.
Peak reverse recovery current
impedance junction to case
versus pulse duration
versus dIF/dt (typical values)
I
(A)
Z
/R
RM
th(j-c) th(j-c)
40
35
30
25
20
15
10
5
1.0
0.9
0.8
0.7
0.6
0.5
0.4
0.3
0.2
0.1
0.0
VR=600V
Tj=125°C
IF=2 x IF(AV)
IF=IF(AV)
IF=0.5 x IF(AV)
Single pulse
t (s)
p
dI /dt(A/µs)
F
0
1.E-03
1.E-02
1.E-01
1.E+00
0
50
100
150
200
250
300
350
400
450
500
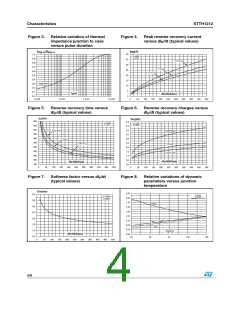
Figure 5.
Reverse recovery time versus
dIF/dt (typical values)
Figure 6.
Reverse recovery charges versus
dIF/dt (typical values)
t (ns)
rr
Q (µC)
rr
600
550
500
450
400
350
300
250
200
150
100
5.0
4.5
4.0
3.5
3.0
2.5
2.0
1.5
1.0
0.5
0.0
VR=600V
Tj=125°C
VR=600V
Tj=125°C
IF=2 x IF(AV)
IF=2 x IF(AV)
IF=IF(AV)
IF=0.5 x IF(AV)
IF=IF(AV)
IF=0.5 x IF(AV)
dI /dt(A/µs)
F
dI /dt(A/µs)
F
0
50
100
150
200
250
300
350
400
450
500
0
50
100
150
200
250
300
350
400
450
500
Figure 7.
Softness factor versus dIF/dt
(typical values)
Figure 8.
Relative variations of dynamic
parameters versus junction
temperature
S factor
2.25
2.00
1.75
1.50
1.25
1.00
0.75
0.50
0.25
4.0
3.5
3.0
2.5
2.0
1.5
1.0
0.5
IF=IF(AV)
VR=600V
Reference: Tj=125°C
IF ≤ 2xIF(AV)
VR=600V
Tj=125°C
S factor
trr
IRM
QRR
T (°C)
j
dI /dt(A/µs)
F
0.00
25
50
75
100
125
0
50
100
150
200
250
300
350
400
450
500
4/9

 STMICROELECTRONICS [ ST ]