Application information
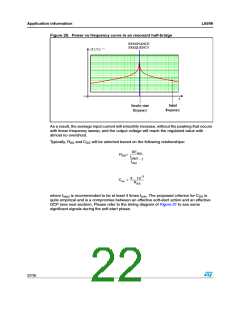
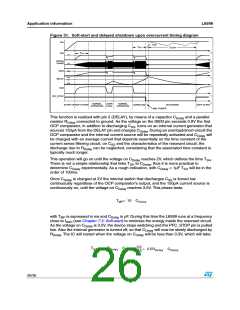
Figure 28. Power vs frequency curve in an resonant half-bridge
L6599
RESONANCE
FREQUENCY
| Z ( f ) | - 1
f
Initial
frequency
Steady-state
frequency
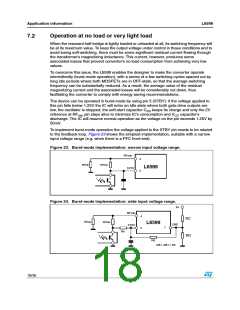
As a result, the average input current will smoothly increase, without the peaking that occurs
with linear frequency sweep, and the output voltage will reach the regulated value with
almost no overshoot.
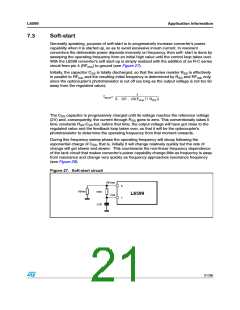
Typically, R and C will be selected based on the following relationships:
SS
SS
RFmin
SS= ---------------------
fstart
R
----------- – 1
fmin
3 ⋅ 10–3
Css = ----------------------
RSS
where f
is recommended to be at least 4 times f . The proposed criterion for C is
min SS
start
quite empirical and is a compromise between an effective soft-start action and an effective
OCP (see next section). Please refer to the timing diagram of Figure 31 to see some
significant signals during the soft-start phase.
22/36

 STMICROELECTRONICS [ ST ]