TOP242-249
BENCH TEST PRECAUTIONS FOR EVALUATION OF ELECTRICAL CHARACTERISTICS
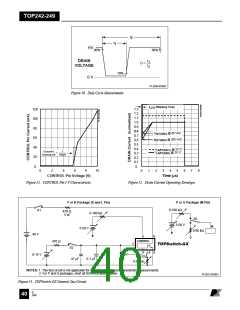
The following precautions should be followed when testing
TOPSwitch-GX by itself outside of a power supply. The
schematic shown in Figure 53 is suggested for laboratory
testing of TOPSwitch-GX.
restart mode, there is only a 12.5% chance that the CONTROL
pin oscillation will be in the correct state (drain active state) so
that the continuous drain voltage waveform may be observed.
It is recommended that the VC power supply be turned on first
and the DRAIN pin power supply second if continuous drain
voltage waveforms are to be observed. The 12.5% chance of
being in the correct state is due to the divide-by-8 counter.
Temporarily shorting the CONTROL pin to the SOURCE pin
will reset TOPSwitch-GX, which then will come up in the
correct state.
When the DRAIN pin supply is turned on, the part will be in the
auto-restartmode. TheCONTROLpinvoltagewillbeoscillating
at a low frequency between 4.8 and 5.8 V and the drain is turned
on every eighth cycle of the CONTROL pin oscillation. If the
CONTROL pin power supply is turned on while in this auto-
Typical Performance Characteristics
PI-2653-033001
1.1
1.0
0.9
0.8
0.7
0.6
0.5
0.4
0.3
Scaling Factors:
200
TOP242:
.45
TOP243 P/G: .75
TOP243 Y/R: .90
180
160
140
TOP244 P/G:
1
TOP244 Y/R: 1.35
TOP245 Y/R: 1.80
TOP246 Y/R: 2.70
TOP247 Y/R: 3.60
TOP248 Y/R: 4.50
TOP249 Y/R: 5.40
120
100
80
60
0.2
40
-250
-200
-150
-100
-50
0
IM (µA)
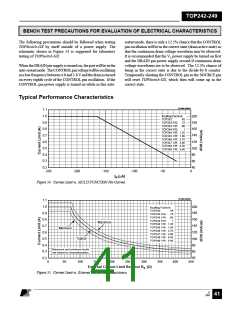
Figure 54. Current Limit vs. MULTI-FUNCTION Pin Current.
PI-2652-033001
1.1
1.0
0.9
200
180
Scaling Factors:
TOP242:
.45
TOP243 P/G: .75
TOP243 Y/R: .90
TOP244 P/G:
TOP244 Y/R: 1.35
TOP245 Y/R: 1.80
TOP246 Y/R: 2.70
TOP247 Y/R: 3.60
TOP248 Y/R: 4.50
TOP249 Y/R: 5.40
160
140
0.8
1
Maximum
0.7
Minimum
120
100
80
0.6
Typical
0.5
0.4
0.3
Maximum and minimum levels
are based on characterization.
60
40
0.2
0
5K
10K
15K
External Current Limit Resistor RIL (Ω)
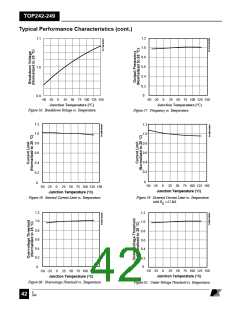
Figure 55. Current Limit vs. External Current Limit Resistance.
20K
25K
30K
35K
40K
45K
E
7/01
August 8, 2000
41

 POWERINT [ Power Integrations ]