PM6341 E1XC
DATA SHEET
PMC-910419
ISSUE 8
E1 FRAMER/TRANSCEIVER
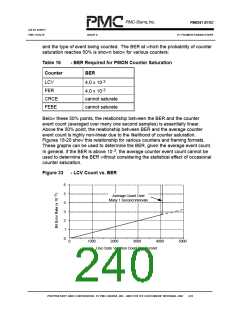
and the type of event being counted. The BER at which the probability of counter
saturation reaches 50% is shown below for various counters:
Table 16
Counter
- BER Required for PMON Counter Saturation
BER
-3
LCV
4.0 x 10
-3
FER
4.0 x 10
CRCE
FEBE
cannot saturate
cannot saturate
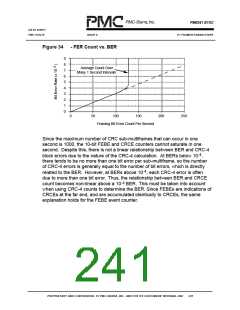
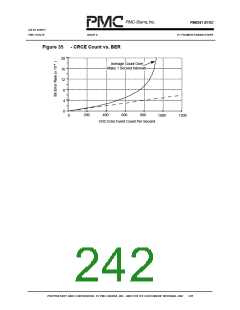
Below these 50% points, the relationship between the BER and the counter
event count (averaged over many one second samples) is essentially linear.
Above the 50% point, the relationship between BER and the average counter
event count is highly non-linear due to the likelihood of counter saturation.
Figures 18-20 show this relationship for various counters and framing formats.
These graphs can be used to determine the BER, given the average event count.
-3
In general, if the BER is above 10 , the average counter event count cannot be
used to determine the BER without considering the statistical effect of occasional
counter saturation.
Figure 33
- LCV Count vs. BER
6
5
4
Average Count Over
Many 1 Second Intervals
3
2
1
0
0
1000
2000
3000
4000
5000
Line Code Violation Count Per Second
PROPRIETARY AND CONFIDENTIAL TO PMC-SIERRA, INC., AND FOR ITS CUSTOMERS’ INTERNAL USE
224

 PMC [ PMC-SIERRA, INC ]