Philips Semiconductors
Product specification
Low power FM IF system
SA614A
From the above equation, the phase shift between nodes 1 and 2, or
A more exact analysis including the source resistance of the
the phase across C will be:
previous stage shows that there is a series and a parallel resonance
in the phase detector tank. To make the parallel and series
resonances close, and to get maximum attenuation of higher
S
ω
(2)
1
Q ω
1
-1
φ =
V
O
-
V =
t
IN
g
harmonics at 455kHz IF, we have found that a C = 10pF and C
=
S
P
ω
2
1
164pF (commercial values of 150pF or 180pF may be practical), will
give the best results. A variable inductor which can be adjusted
around 0.7mH should be chosen and optimized for minimum
–
( ω )
1
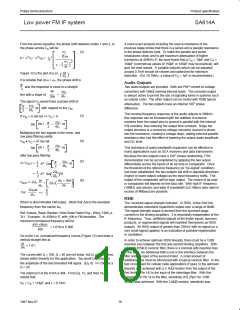
Figure 12 is the plot of φ vs. (ωω )
distortion. (For 10.7MHz, a value of C = 1pF is recommended.)
S
1
It is notable that at ω = ω , the phase shift is
1
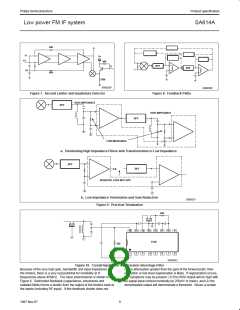
Audio Outputs
Two audio outputs are provided. Both are PNP current-to-voltage
π
and the response is close to a straight
2
∆φ
converters with 55kΩ nominal internal loads. The unmuted output
is always active to permit the use of signaling tones in systems such
as cellular radio. The other output can be muted with 70dB typical
2Q
ω1
1
=
line with a slope of
∆ω
The signal V would have a phase shift of
O
attenuation. The two outputs have an internal 180° phase
difference.
2Q
ω1
π
2
1
ω
with respect to the V
.
–
IN
The nominal frequency response of the audio outputs is 300kHz.
this response can be increased with the addition of external
resistors from the output pins to ground in parallel with the internal
55k resistors, thus lowering the output time constant. Singe the
output structure is a current-to-voltage converter (current is driven
into the resistance, creating a voltage drop), adding external parallel
resistance also has the effect of lowering the output audio amplitude
and DC level.
(3)
(4)
If V = A Sin ωt
V = A
O
IN
2Q
π
1
ωt +
ω
Sin
–
ω1
2
Multiplying the two signals in the mixer, and
low pass filtering yields:
2
V
IN • V = A Sin ωt
O
2Q
ω1
π
ωt +
1
ω
This technique of audio bandwidth expansion can be effective in
many applications such as SCA receivers and data transceivers.
Sin
–
2
after low pass filtering
1
Because the two outputs have a 180° phase relationship, FSK
demodulation can be accomplished by applying the two output
differentially across the inputs of an op amp or comparator. Once
the threshold of the reference frequency (or “no-signal” condition)
has been established, the two outputs will shift in opposite directions
(higher or lower output voltage) as the input frequency shifts. The
output of the comparator will be logic output. The choice of op amp
or comparator will depend on the data rate. With high IF frequency
(10MHz and above), and wide IF bandwidth (L/C filters) data rates in
excess of 4Mbaud are possible.
(5)
(6)
2Q
ω1
π
1
2
V
OUT
=
ω
A
Cos
–
2
2
2Q
1
2
1
2
ω
=
A
Sin
( ω )
1
ω1 + ∆ω
ω
2Q
1
V
OUT
=
2Q
(
)
1
ω1
ω1
2Q ω
ω1
π
2
1
For
<<
RSSI
Which is discriminated FM output. (Note that ∆ω is the deviation
frequency from the carrier ω1.
The “received signal strength indicator”, or RSSI, of the SA614A
demonstrates monotonic logarithmic output over a range of 90dB.
The signal strength output is derived from the summed stage
currents in the limiting amplifiers. It is essentially independent of the
IF frequency. Thus, unfiltered signals at the limiter inputs, spurious
products, or regenerated signals will manifest themselves as RSSI
outputs. An RSSI output of greater than 250mV with no signal (or a
very small signal) applied, is an indication of possible regeneration
or oscillation.
Ref. Krauss, Raab, Bastian; Solid State Radio Eng.; Wiley, 1980, p.
311. Example: At 455kHz IF, with +5kHz FM deviation. The
maximum normalized frequency will be
455 +5kHz
= 1.010 or 0.990
455
Go to the f vs. normalized frequency curves (Figure 12) and draw a
vertical straight line at
In order to achieve optimum RSSI linearity, there must be a 12dB
insertion loss between the first and second limiting amplifiers. With
a typical 455kHz ceramic filter, there is a nominal 4dB insertion loss
in the filter. An additional 6dB is lost in the interface between the
filter and the input of the second limiter. A small amount of
ω
= 1.01.
ω1
The curves with Q = 100, Q = 40 are not linear, but Q = 20 and less
shows better linearity for this application. Too small Q decreases
additional loss must be introduced with a typical ceramic filter. In the
test circuit used for cellular radio applications (Figure 5) the optimum
the amplitude of the discriminated FM signal. (Eq. 6)
Q = 20
Choose a
linearity was achieved with a 5.1kΩ resistor from the output of the
first limiter (Pin 14) to the input of the interstage filter. With this
resistor from Pin 14 to the filter, sensitivity of 0.25µV for 12dB
The internal R of the 614A is 40k. From Eq. 1c, and then 1b, it
results that
SINAD was achieved. With the 3.6kΩ resistor, sensitivity was
C
+ C = 174pF and L = 0.7mH.
S
P
10
1997 Nov 07

 NXP [ NXP ]