Freescale Semiconductor, Inc.
154
153
152
151
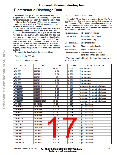
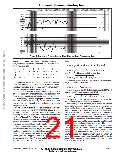
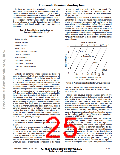
UCL = 152.8
= 150.4
X
150
149
LCL = 148.0
148
147
UCL = 7.3
7
6
5
4
= 3.2
R
3
2
1
0
LCL = 0
Figure 4. Example of Process Control Chart Showing Oven Temperature Data
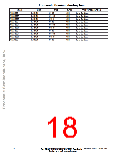
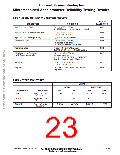
Where D4, D3 and A2 are constants varying by sample
size,with values for sample sizes from 2 to 10 shown in the
following partial table:
Since:
tot
tot
2
2
2
2
2
A
2
B
C
D
E
n
2
3
4
5
6
7
8
9
10
3.27 2.57 2.28 2.11 2.00 1.92 1.86 1.82 1.78
0.08 0.14 0.18 0.22
1.88 1.02 0.73 0.58 0.48 0.42 0.37 0.34 0.31
2
2
2
2
(
)
5
3
2
1
0.4
6.3
D
4
3
2
Now if only D is identified and eliminated then;
D
A
*
*
*
*
*
2
2
2
2
(
)
tot
5
3
2
0.4
6.2
This results in less than 2% total variability improvement.
If B, C and D were eliminated, then;
* For sample sizes below 7, the LCL would technically be
R
a negative number; in those cases there is no lower control
limit; this means that for a subgroup size 6, six “identical”
measurements would not be unreasonable.
Control charts are used to monitor the variability of critical
process parameters. The R chart shows basic problems with
piece to piece variability related to the process. The X chart
can often identify changes in people, machines, methods,
etc. The source of the variability can be difficult to find and
may require experimental design techniques to identify
assignable causes.
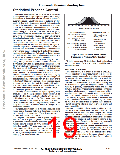
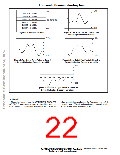
Some general rules have been established to help deter-
mine when a process is OUT-OF-CONTROL. Figure 5 shows
a control chart subdivided into zones A, B, and C corre-
sponding to 3 sigma, 2 sigma, and 1 sigma limits respectively.
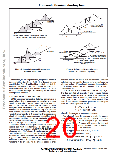
In Figure 6 through Figure 9 four of the tests that can be used
toidentifyexcessivevariabilityandthepresenceofassignable
causes are shown. As familiarity with a given process
increases, more subtle tests may be employed successfully.
Once the variability is identified, the cause of the variability
mustbedetermined. Normally,onlyafewfactorshaveasignif-
icant impact on the total variability of the process. The impor-
tance of correctly identifying these factors is stressed in the
following example. Suppose a process variability depends on
the variance of five factors A, B, C, D and E. Each has a vari-
ance of 5, 3, 2, 1 and 0.4 respectively.
2
2
(
)
tot
5
0.4
5.02
This gives a considerably better improvement of 23%. If
only A is identified and reduced from 5 to 2, then;
2
2
2
2
2
(
)
tot
2
3
2
1
0.4
4.3
Identifying and improving the variability from 5 to 2 gives
us a total variability improvement of nearly 40%.
Most techniques may be employed to identify the primary
assignable cause(s). Out-of-control conditions may be
correlated to documented process changes. The product
may be analyzed in detail using best versus worst part
comparisons or Product Analysis Lab equipment. Multi-vari-
ance analysis can be used to determine the family of varia-
tion (positional, critical or temporal). Lastly, experiments may
be run to test theoretical or factorial analysis. Whatever
method is used, assignable causes must be identified and
eliminated in the most expeditious manner possible.
After assignable causes have been eliminated, new
control limits are calculated to provide a more challenging
variability criteria for the process. As yields and variability
improve, it may become more difficult to detect improve-
ments because they become much smaller. When all
assignable causes have been eliminated and the points
remain within control limits for 25 groups, the process is said
to be in a state of control.
Motorola Sensor Device Data
www.motorola.com/semiconductors
1–15
For More Information On This Product,
Go to: www.freescale.com

 MOTOROLA [ MOTOROLA ]