Freescale Semiconductor, Inc.
Statistical Process Control
Motorola’s Semiconductor Products Sector is continually
pursuing new ways to improve product quality. Initial design
improvement is one method that can be used to produce a
superior product. Equally important to outgoing product
quality is the ability to produce product that consistently
conforms to specification. Process variability is the basic
enemy of semiconductor manufacturing since it leads to
product variability. Used in all phases of Motorola’s product
manufacturing, STATISTICAL PROCESS CONTROL (SPC)
replaces variability with predictability. The traditional philos-
ophy in the semiconductor industry has been adherence to
the data sheet specification. Using SPC methods assures
the product will meet specific process requirements
throughout the manufacturing cycle. The emphasis is on
defect prevention, not detection. Predictability through SPC
methods requires the manufacturing culture to focus on
constant and permanent improvements. Usually these
improvements cannot be bought with state-of-the-art equip-
ment or automated factories. With quality in design, process
and material selection, coupled with manufacturing predict-
ability, Motorola produces world class products.
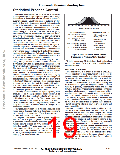
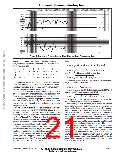
-6σ -5σ -4σ -3σ -2σ -1σ
1σ 2σ 3σ 4σ 5σ 6σ
0
Standard Deviations From Mean
Distribution Shifted ± 1.5
66810 ppm defective
93.32% yield
Distribution Centered
At ± 3 σ 2700 ppm defective
99.73% yield
At ± 4 σ 63 ppm defective
6210 ppm defective
99.379% yield
99.9937% yield
At ± 5 σ 0.57 ppm defective
233 ppm defective
99.9767% yield
99.999943% yield
At ± 6 σ 0.002 ppm defective
3.4 ppm defective
99.99966% yield
99.9999998% yield
Figure 1. AOQL and Yield from a Normal
Distribution of Product With 6σ Capability
The immediate effect of SPC manufacturing is predict-
ability through process controls. Product centered and
distributed well within the product specification benefits
Motorola with fewer rejects, improved yields and lower cost.
The direct benefit to Motorola’s customers includes better
incoming quality levels, less inspection time and ship-to-
stock capability. Circuit performance is often dependent on
the cumulative effect of component variability. Tightly
controlled component distributions give the customer greater
circuit predictability. Many customers are also converting to
just-in-time (JIT) delivery programs. These programs require
improvements in cycle time and yield predictability achiev-
able only through SPC techniques. The benefit derived from
SPC helps the manufacturer meet the customer’s expecta-
tions of higher quality and lower cost product.
Ultimately, Motorola will have Six Sigma capability on all
products. This means parametric distributions will be
centered within the specification limits with a product
distribution of plus or minus Six Sigma about mean. Six
Sigma capability, shown graphically in Figure 1, details the
benefit in terms of yield and outgoing quality levels. This
compares a centered distribution versus a 1.5 sigma worst
case distribution shift.
To better understand SPC principles, brief explanations
have been provided. These cover process capability, imple-
mentation and use.
PROCESS CAPABILITY
One goal of SPC is to ensure a process is CAPABLE.
Process capability is the measurement of a process to
produce products consistently to specification requirements.
The purpose of a process capability study is to separate the
inherent RANDOM VARIABILITY from ASSIGNABLE
CAUSES. Once completed, steps are taken to identify and
eliminate the most significant assignable causes. Random
variability is generally present in the system and does not
fluctuate. Sometimes, these are considered basic limitations
associated with the machinery, materials, personnel skills or
manufacturing methods. Assignable cause inconsistencies
relate to time variations in yield, performance or reliability.
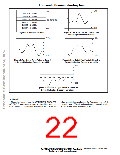
Traditionally, assignable causes appear to be random due
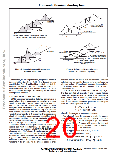
to the lack of close examination or analysis. Figure 2 shows
the impact on predictability that assignable cause can have.
Figure 3 shows the difference between process control and
process capability.
A process capability study involves taking periodic
samples from the process under controlled conditions. The
performance characteristics of these samples are charted
against time. In time, assignable causes can be identified
and engineered out. Careful documentation of the process is
key to accurate diagnosis and successful removal of the
assignable causes. Sometimes, the assignable causes will
remain unclear requiring prolonged experimentation.
Elements which measure process variation control and
capability are Cp and Cpk respectively. Cp is the
specification width divided by the process width or Cp =
(specification width) / 6σ. Cpk is the absolute value of the
closest specification value to the mean, minus the mean,
divided by half the process width or Cpk = | closest
New product development at Motorola requires more
robust design features that make them less sensitive to
minor variations in processing. These features make the
implementation of SPC much easier.
A complete commitment to SPC is present throughout
Motorola. All managers, engineers, production operators,
supervisors and maintenance personnel have received
multiple training courses on SPC techniques. Manufac-
turing has identified 22 wafer processing and 8 assembly
steps considered critical to the processing of semiconductor
products. Processes, controlled by SPC methods, that have
shown significant improvement are in the diffusion, photoli-
thography and metallization areas.
specification –
.
/3σ
X
Motorola Sensor Device Data
www.motorola.com/semiconductors
1–13
For More Information On This Product,
Go to: www.freescale.com

 MOTOROLA [ MOTOROLA ]