PIC12CE67X
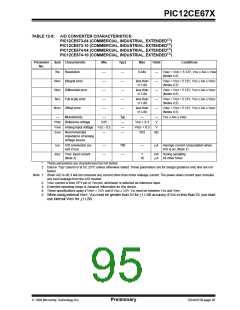
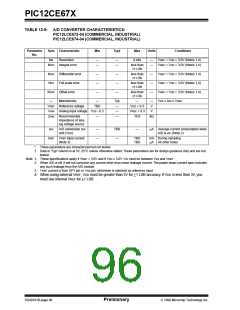
13.0 DC AND AC CHARACTERISTICS - PIC12CE67X
The graphs and tables provided in this section are for design guidance and are not tested. In some graphs or tables the
data presented are outside specified operating range (e.g., outside specified VDD range). This is for information only
and devices will operate properly only within the specified range.
The data presented in this section is a statistical summary of data collected on units from different lots over a period of
time. “Typical” represents the mean of the distribution while “max” or “min” represents (mean + 3σ) and (mean – 3σ)
respectively, where σ is standard deviation.
FIGURE 13-1: CALIBRATED INTERNAL RC FREQUENCY RANGE VS.TEMPERATURE (VDD = 5.0V)
(INTERNAL RC IS CALIBRATED TO 25°C, 5.0V)
TO BE DETERMINED
FIGURE 13-2: CALIBRATED INTERNAL RC FREQUENCY RANGE VS.TEMPERATURE (VDD = 3.0V)
(INTERNAL RC IS CALIBRATED TO 25°C, 5.0V)
TO BE DETERMINED
1998 Microchip Technology Inc.
Preliminary
DS40181B-page 99

 MICROCHIP [ MICROCHIP ]