ICL8038
FM Linearity. The percentage deviation from the best fit
straight line on the control voltage versus output frequency
curve.
Definition of Terms
Supply Voltage (V
). The total supply voltage from
SUPPLY
V+ to V-.
Output Amplitude. The peak-to-peak signal amplitude
appearing at the outputs.
Supply Current. The supply current required from the
power supply to operate the device, excluding load currents
and the currents through R and R .
A
B
Saturation Voltage. The output voltage at the collector of
Q
when this transistor is turned on. It is measured for a
23
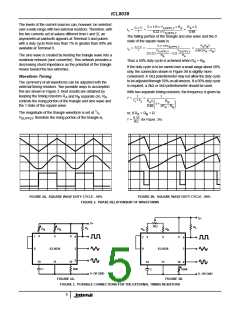
Frequency Range. The frequency range at the square wave
output through which circuit operation is guaranteed.
sink current of 2mA.
Rise and Fall Times. The time required for the square wave
output to change from 10% to 90%, or 90% to 10%, of its
final value.
Sweep FM Range. The ratio of maximum frequency to
minimum frequency which can be obtained by applying a
sweep voltage to pin 8. For correct operation, the sweep
voltage should be within the range:
Triangle Waveform Linearity. The percentage deviation
from the best fit straight line on the rising and falling triangle
waveform.
2
( / V
+ 2V) < V
< V
SWEEP SUPPLY
3
SUPPLY
Total Harmonic Distortion. The total harmonic distortion at
the sine wave output.
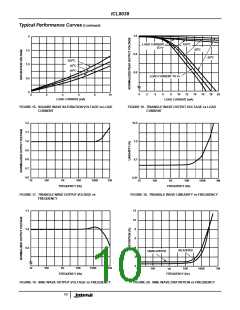
Typical Performance Curves
20
1.03
1.02
1.01
1.00
0.99
0.98
o
-55 C
15
10
5
o
125 C
o
25 C
5
10
15
20
25
30
5
10
15
20
25
30
SUPPLY VOLTAGE (V)
SUPPLY VOLTAGE (V)
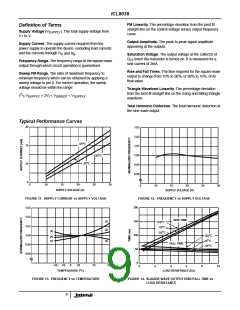
FIGURE 11. SUPPLY CURRENT vs SUPPLY VOLTAGE
FIGURE 12. FREQUENCY vs SUPPLY VOLTAGE
200
150
100
50
1.03
1.02
RISE TIME
o
10
125 C
1.01
1.00
0.99
0.98
o
25 C
20
30
30
o
-55 C
o
125 C
20
10
o
25 C
FALL TIME
o
-55 C
0
-50 -25
0
25
75
125
0
2
4
6
8
10
o
LOAD RESISTANCE (kΩ)
TEMPERATURE ( C)
FIGURE 13. FREQUENCY vs TEMPERATURE
FIGURE 14. SQUARE WAVE OUTPUT RISE/FALL TIME vs
LOAD RESISTANCE
9

 INTERSIL [ Intersil ]