Electrical Specifications
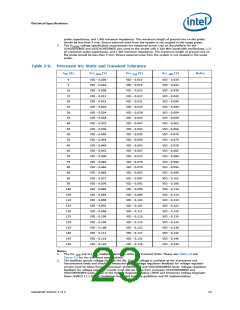
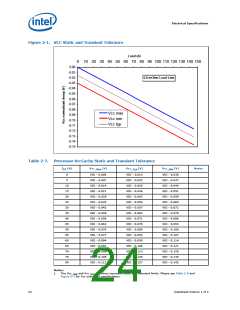
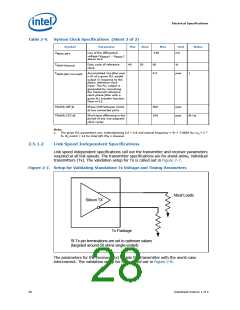
Figure 2-1. VCC Static and Transient Tolerance
Load (A)
0
10 20 30 40 50 60 70 80 90 100 110 120 130 140 150
0.00
-0.01
-0.02
-0.03
-0.04
-0.05
-0.06
-0.07
-0.08
-0.09
-0.10
-0.11
-0.12
-0.13
-0.14
-0.15
0.8 mOhm Load Line
Vcc max
Vcc min
Vcc typ
Table 2-7.
Processor VccCache Static and Transient Tolerance
I
(A)
Vcc
(V)
Vcc
(V)
Vcc (V)
_Min
Notes
CC
_Max
_Typ
0
VID - 0.000
VID - 0.007
VID - 0.014
VID - 0.021
VID - 0.028
VID - 0.035
VID - 0.042
VID - 0.049
VID - 0.056
VID - 0.063
VID - 0.070
VID - 0.077
VID - 0.084
VID - 0.091
VID - 0.098
VID - 0.105
VID - 0.112
VID - 0.015
VID - 0.022
VID - 0.029
VID - 0.036
VID - 0.043
VID - 0.050
VID - 0.057
VID - 0.064
VID - 0.071
VID - 0.078
VID - 0.085
VID - 0.092
VID - 0.099
VID - 0.106
VID - 0.113
VID - 0.120
VID - 0.127
VID - 0.030
VID - 0.037
VID - 0.044
VID - 0.051
VID - 0.058
VID - 0.065
VID - 0.072
VID - 0.079
VID - 0.086
VID - 0.093
VID - 0.100
VID - 0.107
VID - 0.114
VID - 0.121
VID - 0.128
VID - 0.135
VID - 0.142
5
10
15
20
25
30
35
40
45
50
55
60
65
70
75
80
Notes:
1.
The Vcc
and Vcc
loadlines represent static and transient limits. Please see Table 2-8 and
_MAX
_MIN
Figure 2-3 for Vcc overshoot specifications.
24
Datasheet Volume 1 of 2

 INTEL [ INTEL ]