Ambassador T8100A, T8102, and T8105
H.100/H.110 Interfaces and Time-Slot Interchangers
Advance Data Sheet
November 1999
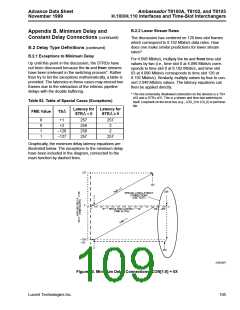
B.2.2 Lower Stream Rates
Appendix B. Minimum Delay and
Constant Delay Connections (continued)
The discussion has centered on 128 time-slot frames
which correspond to 8.192 Mbits/s data rates. How
does one make similar predictions for lower stream
rates?
B.2 Delay Type Definitions (continued)
B.2.1 Exceptions to Minimum Delay
For 4.096 Mbits/s, multiply the to and from time-slot
values by two (i.e., time slot 0 at 4.096 Mbits/s corre-
sponds to time slot 0 at 8.192 Mbits/s, and time slot
63 at 4.096 Mbits/s corresponds to time slot 126 at
8.192 Mbits/s). Similarly, multiply values by four to con-
vert 2.048 Mbits/s values. The latency equations can
then be applied directly.
Up until this point in the discussion, the STRDs have
not been discussed because the to and from streams
have been irrelevant in the switching process*. Rather
than try to list the exceptions mathematically, a table is
provided. The latencies in these cases may exceed two
frames due to the interaction of the intrinsic pipeline
delays with the double buffering.
* The one universally disallowed connection on the devices is a TS∆
of 0 and a STR∆ of 0. This is a stream and time-slot switching to
itself. Loopback on the local bus (e.g., LDO_0 to LDI_0) is permissi-
ble.
Table 83. Table of Special Cases (Exceptions)
Latency for Latency for
FME Value
TS∆
STR∆ < 0
STR∆ ≥ 0
0
0
1
1
+1
+2
257
258
258
257
257
2
–126
–127
2
257
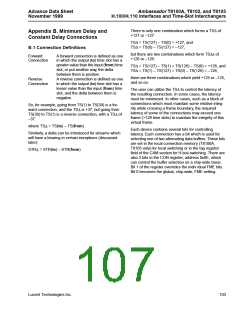
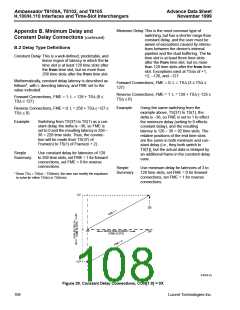
Graphically, the minimum delay latency equations are
illustrated below. The exceptions to the minimum delay
have been included in the diagram, connected to the
main function by dashed lines.
127
127
258
SPECIAL LONG LATENCY
CONNECTIONS
(SEE TEXT)
2
2
0
0
RESULTING LATENCY
(TIME SLOTS)
128......256
–126
–127
2
257
5-6224(F)
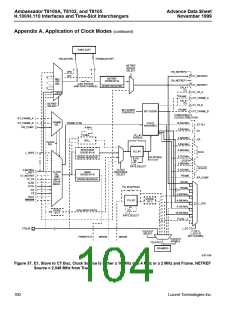
Figure 40. Minimum Delay Connections, CON[1:0] = 0X
Lucent Technologies Inc.
105

 AGERE [ AGERE SYSTEMS ]