a-Si TFT LCD Single Chip Driver
240RGBx320 Resolution and 262K color
ILI9325
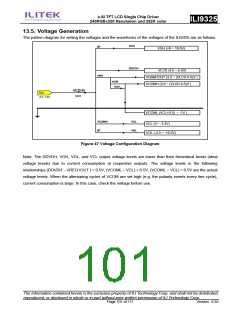
13.5. Voltage Generation
The pattern diagram for setting the voltages and the waveforms of the voltages of the ILI9325 are as follows.
VGH
BT
VGH (+9 ~ 16.5V)
DDVDH
VLCD (4.5 ~ 5.5V)
VRH
VGAM1OUT (3.0 ~ (VLCD-0.5)V )
VCOMH (3.0 ~ (VLCD-0.5)V )
VCM
VDV
VC[2:0]
Vci
(2.5 ~ 3.3V)
VCI1
VCOML (VCL+0.5) ~ -1V )
VCOMG
BT
VCL
VGL
VCL (0 ~ -3.3V)
VGL (-4.0 ~ -16.5V)
Figure 47 Voltage Configuration Diagram
Note: The DDVDH, VGH, VGL, and VCL output voltage levels are lower than their theoretical levels (ideal
voltage levels) due to current consumption at respective outputs. The voltage levels in the following
relationships (DDVDH – VREG1OUT ) > 0.5V, (VCOML – VCL) > 0.5V, (VCOML – VCL) > 0.5V are the actual
voltage levels. When the alternating cycles of VCOM are set high (e.g. the polarity inverts every line cycle),
current consumption is large. In this case, check the voltage before use.
The information contained herein is the exclusive property of ILI Technology Corp. and shall not be distributed,
reproduced, or disclosed in whole or in part without prior written permission of ILI Technology Corp.
Page 101 of 111
Version: 0.35

 ETC [ ETC ]