MEASUREMENT TEMPERATURE SPAN ∆T (°C)
300°C 400°C 500°C 600°C 700°C
–200°C 18.7/86.6 18.7/169 18.7/255 18.7/340 18.7/422 18.7/511 18.7/590 18.7/665 18.7/750 18.7/845
TMIN
100°C
200°C
800°C
900°C
1000°C
15000
16500
9760
11500
8060
10000
6650
8870
5620
7870
4750
7150
4020
6420
3480
5900
3090
5360
2740
4990
–100°C 60.4/80.6 60.4/162 60.4/243 60.4/324 60.4/402 60.4/487 60.4/562 60.4/649 60.4/732
27400
29400
15400
17800
10500
13000
7870
10200
6040
8660
4990
7500
4220
6490
3570
5900
3090
5360
0°C
100/78.7 100/158
100/237
10500
13000
100/316
7680
10000
100/392
6040
8250
100/475
4870
7150
100/549
4020
6340
100/634
3480
5620
33200
35700
16200
18700
100°C
200°C
300°C
400°C
500°C
600°C
700°C
800°C
137/75
31600
34000
137/150
15400
17800
137/226
10200
12400
137/301
7500
9760
137/383
5760
8060
137/453
4750
6810
137/536
3920
6040
RZ /RG
RLIN1
RLIN2
174/73.2 174/147
30900
33200
174/221
9760
12100
174/294
7150
9310
174/365
5620
7680
174/442
4530
6490
15000
17400
210/71.5 210/143
30100
32400
210/215
9530
11500
210/287
6980
8870
210/357
5360
7320
14700
16500
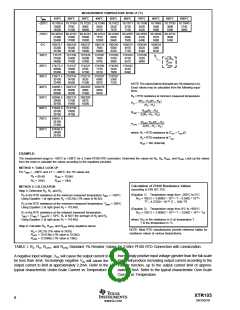
NOTE:Thevalueslistedinthistableare1%resistors(inΩ).
Exact values may be calculated from the following equa-
tions:
249/68.1 249/137
28700
30900
249/205
9090
11000
249/274
6650
8450
14000
16200
RZ = RTD resistance at minimum measured temperature.
280/66.5 280/133
28000
30100
280/200
8870
10500
13700
15400
2(R2 –RZ )(R1 –RZ )
RG
=
(R2 –R1)
316/64.9 313/130
26700
28700
R
LIN(R2 –R1)
13000
14700
RLIN1
=
2(2R1 –R2 –RZ )
348/61.9
26100
27400
(RLIN +RG)(R2 –R1)
2(2R1 –R2 –RZ )
RLIN2
=
374/60.4
24900
26700
where: R1 = RTD resistance at (TMIN + TMAX)/2
R2 = RTD resistance at TMAX
RLIN = 1kΩ (Internal)
EXAMPLE:
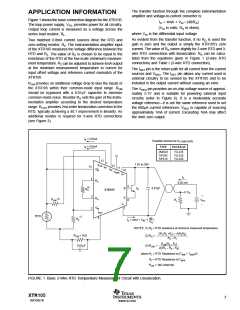
The measurement range is –100°C to +200°C for a 3-wire Pt100 RTD connection. Determine the values for RS, RG, RLIN1, and RLIN2. Look up the values
from the chart or calculate the values according to the equations provided.
METHOD 1: TABLE LOOK UP
For TMIN = –100°C and ∆T = –300°C, the 1% values are:
RZ = 60.4Ω
RG = 243Ω
RLIN1 = 10.5kΩ
RLIN2 = 13kΩ
Calculation of Pt100 Resistance Values
METHOD 2: CALCULATION
(according to DIN IEC 751)
Step 1: Determine RZ, R1, and R2.
(Equation 1) Temperature range from –200°C to 0°C:
RZ is the RTD resistance at the minimum measured temperature,TMIN = –100°C.
Using Equation 1 at right gives RZ = 60.25Ω (1% value is 60.4Ω).
R(T) = 100 [1 + 3.90802 • 10–3 • T – 0.5802 • 10–6
T2 – 4.27350 • 10–12 (T – 100) T3]
•
R2 is the RTD resistance at the maximum measured temperature, TMAX = 200°C.
Using Equation 2 at right gives R2 = 175.84Ω.
(Equation 2) Temperature range from 0°C to +850°C:
R(T) = 100 (1 + 3.90802 • 10–3 • T – 0.5802 • 10–6 • T2)
R1 is the RTD resistance at the midpoint measured temperature,
TMID = (TMIN + TMAX)/2 = 50°C. R1 is NOT the average of RZ and R2.
Using Equation 2 at right gives R1 = 119.40Ω.
where: R(T) is the resistance in Ω at temperature T.
T is the temperature in °C.
Step 2: Calculate RG, RLIN1, and RLIN2 using equations above.
NOTE: Most RTD manufacturers provide reference tables for
resistance values at various temperatures.
RG = 242.3Ω (1% value is 243Ω)
RLIN1 = 10.413kΩ (1% value is 10.5kΩ)
RLIN2 = 12.936kΩ (1% value is 13kΩ)
TABLE I. RZ, RG, RLIN1, and RLIN2 Standard 1% Resistor Values for 3-Wire Pt100 RTD Connection with Linearization.
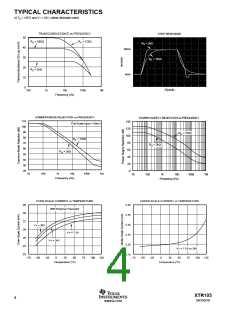
A negative input voltage, VIN, will cause the output current to
be less than 4mA. Increasingly negative VIN will cause the
output current to limit at approximately 2.2mA. Refer to the
typical characteristic Under-Scale Current vs Temperature.
Increasingly positive input voltage (greater than the full-scale
input) will produce increasing output current according to the
transfer function, up to the output current limit of approxi-
mately 27mA. Refer to the typical characteristic Over-Scale
Current vs Temperature.
XTR105
8
SBOS061B
www.ti.com

 TI [ TEXAS INSTRUMENTS ]