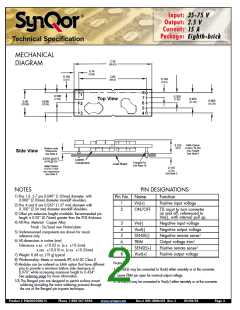
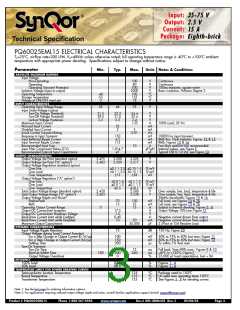
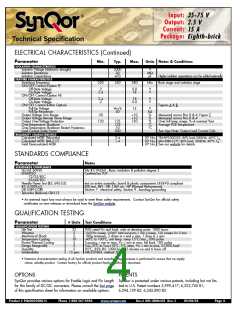
Input:
Output:
35-75 V
2.5 V
Current:
Package:
15 A
Eighth-brick
Technical Specification
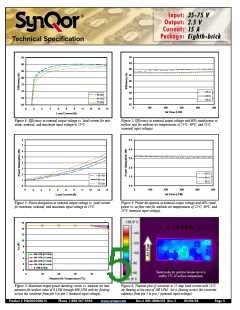
90
89
88
87
86
85
84
83
82
95
90
85
80
75
70
65
60
25 C
40 C
55 C
35 Vin
48 Vin
75 Vin
0
100
200
300
400
500
0
2
3
5
6
8
9
11
12
14
15
Air Flow (LFM)
Load Current (A)
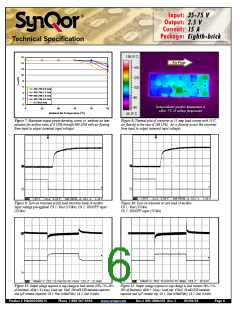
Figure 1: Efficiency at nominal output voltage vs. load current for min-
Figure 2: Efficiency at nominal output voltage and 60% rated power vs.
imum, nominal, and maximum input voltage at 25
°C.
airflow rate for ambient air temperatures of 25
(nominal input voltage).
°C, 40°C, and 55°C
8
7
6
5
4
3
2
1
0
5.0
4.0
3.0
2.0
1.0
0.0
25 C
40 C
55 C
35 Vin
48 Vin
75 Vin
0
100
200
300
400
500
0
2
3
5
6
8
9
11
12
14
15
Air Flow (LFM)
Load Current (A)
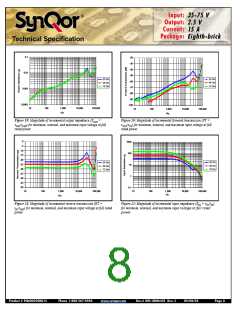
Figure 3: Power dissipation at nominal output voltage vs. load current
Figure 4: Power dissipation at nominal output voltage and 60% rated
power vs. airflow rate for ambient air temperatures of 25 C, 40 C, and
55 C (nominal input voltage).
for minimum, nominal, and maximum input voltage at 25
°C.
°
°
°
16
14
12
10
8
6
400 LFM (2.0 m/s)
300 LFM (1.5 m/s)
4
200 LFM (1.0 m/s)
2
0
100 LFM (0.5 m/s)
0 LFM (0 m/s)
Semiconductor junction temperature is
within 1 C of surface temperature
0
25
40
55
70
85
°
Ambient Air Temperature (oC)
Figure 5: Maximum output power derating curves vs. ambient air tem-
perature for airflow rates of 0 LFM through 400 LFM with air flowing
across the converter from pin 3 to pin 1 (nominal input voltage).
Figure 6: Thermal plot of converter at 15 amp load current with 55°C
air flowing at the rate of 200 LFM. Air is flowing across the converter
sideways from pin 3 to pin 1 (nominal input voltage).
Product # PQ60025EML15
Phone 1-888-567-9596
www.synqor.com
Doc.# 005-2EM625E Rev. C
09/08/05
Page 5

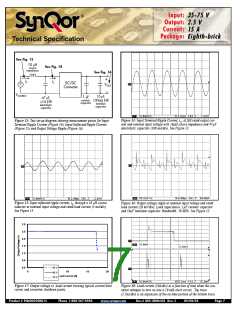
 SYNQOR [ SYNQOR WORLDWIDE HEADQUARTERS ]