LA7386
Continued from preceding page.
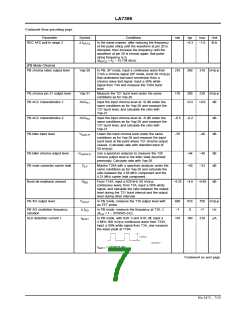
Parameter
Symbol
∆ f
Conditions
min
typ
max
–1.0
Unit
kHz
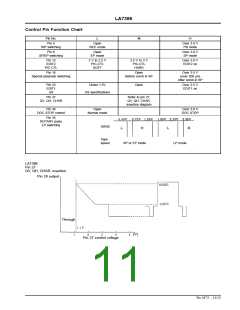
REC AFC pull-in range 2
In the same manner, after reducing the frequency
of the pulse string until the waveform at pin 20 is
disrupted, then increase the frequency until the
waveform at pin 20 is normal again; that pulse
–6.3
AFC2
string frequency is f
2
∆f
= f – 15.734 (kHz)
AFC2
2
[PB Mode Chroma]
PB chroma video output level
Vop-28
Vop-21
In PB, SP mode, input a continuous wave from
T14A a chroma signal (SP mode, burst 50 mVp-p)
that underwent low-band conversion from a
chroma noise test signal. Input a 50% white
signal from T3A and measure the T28A burst
level
210
170
260
310 mVp-p
PB chroma pin 21 output level
PB ACC characteristics 1
Measure the T21 burst level under the same
conditions as for Vop-28
200
230 mVp-p
ACC
Input the input chroma level at +6 dB under the
same conditions as for Vop-28 and measure the
T21 burst level, and calculate the ratio with
Vop-21
+0.5
+0.8
dB
dB
dB
P1
PB ACC characteristics 2
PB killer input level
ACC
Input the input chroma level at –6 dB under the
same conditions as for Vop-28 and measure the
T21 burst level, and calculate the ratio with
Vop-21
–0.5
–55
–0.2
P2
V
Lower the input chroma level under the same
conditions as for Vop-28 and measure the input
burst level at the point where T21 chroma output
ceases. (Calculate ratio with standard input of
50 mVp-p)
–40
ACK-P
PB killer chroma output level
PB main converter carrier leak
V
Use a spectrum analyzer to measure the T28
chroma output level in the killer state described
previously. Calculate ratio with Vop-28.
–44
–40
–40
–33
dB
dB
OACK-P
C
Monitor T28A with a spectrum analyzer under the
same conditions as for Vop-28 and calculate the
ratio between the 3.58 MHz component and the
4.21 MHz carrier leak component.
LP
Burst de-emphasis amount
PB XO output level
G
From T14A, input a 629 kHz 50 mVp-p
continuous wave; from T3A, input a 50% white
signal, and calculate the ratio between the output
level during the T21 burst interval and the output
level during other intervals
–4.35
–4.6
–4.85
dB
BD
V
In PB mode, measure the T18 output level with
an FET probe
480
–7
610
0
750 mVp-p
XO-P
PB XO oscillation frequency
variation
∆ f
In PB mode, measure the frequency at T18...f
+7
Hz
µA
XO
∆f
= f – 3579545 (Hz)
XO
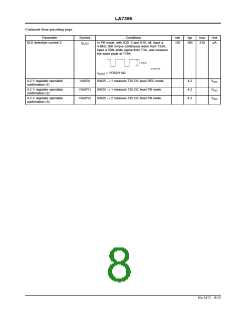
SLD detection current 1
I
In PB mode, with S20: 3 and S19: off, input a
4 MHz 300 mVp-p continuous wave from T33A,
input a 50% white signal from T3A, and measure
the wave peak at T19A
110
160
210
SLD1
I
= VOS1/1 kΩ
SLD1
Continued on next page.
No.5472 - 7/13

 SANYO [ SANYO SEMICON DEVICE ]