LA7386
Continued from preceding page.
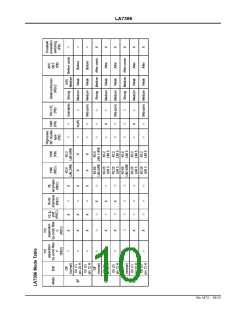
Parameter
Symbol
ACC
Conditions
= standard color bar signal (1 Vp-p),
min
typ
max
–24
Unit
dB
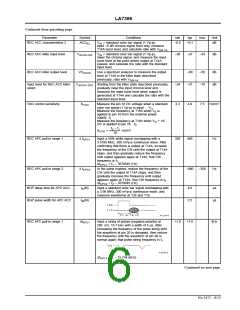
REC ACC characteristics 2
V
–0.5
–0.1
R2
IN
input –6 dB chroma signal level only, measure
T14A burst level, and calculate ratio with V
OR-14
REC ACC killer input level
REC ACC killer output level
V
V
= standard color bar signal (1 Vp-p),
IN
–30
–27
dB
ACCK-ON
lower the chroma signal, and measure the input
burst level at the point where output at T14A
ceases, and calculate the ratio with the standard
input level
VO
ACCK
Use a spectrum analyzer to measure the output
level at T14A in the killer state described
previously; ratio with V
OR-14
–60
–21
–50
–18
dB
dB
Input level for REC ACC killer
return
V
Starting from the killer state described previously,
gradually raise the input chroma level and
measure the input burst level when output is
generated at T14A and calculate the ratio with the
standard input level
–24
3.3
ACCK–OFF
VXO control sensitivity
S
Measure the pin 16 DC voltage when a standard
4.9
7.5
Hz/mV
VXO
color bar signal (1 Vp-p) is input ... V
Measure the frequency at T18A when V is
applied to pin 16 from the external power
O
0
supply...f
1
Measure the frequency at T18A when V + 10
O
mV is applied to pin 16 ...f
2
f
– f
2
1
S
=
Hz/mV
VXO
10
REC APC pull-in range 1
∆ f
APC1
Input a 50% white signal overlapping with a
3.5795 MHz, 300 mVp-p continuous wave. After
confirming that there is output at T14A, increase
the frequency of the CW until the output at T14A
stops, and then gradually reduce the frequency
until output appears again at T14A; that CW
350
440
Hz
frequency is f .
1
∆f
= f – 3579545 (Hz)
APC1
1
REC APC pull-in range 2
∆ f
APC2
In the same manner, reduce the frequency of the
CW until the output at T14A stops, and then
gradually increase the frequency until output
–900
–350
Hz
appears again at T14A; that CW frequency is f .
2
∆f
= f – 3579545 (Hz)
APC2
2
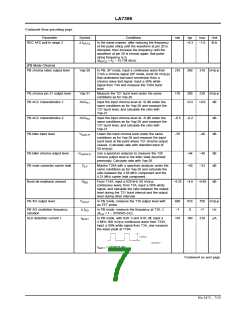
BGP delay time for APC ACC
BGP pulse width for APC ACC
t (N)
Input a standard color bar signal overlapping with
a 3.98 MHz, 300 mVp-p continuous wave, and
measure waveforms at T26 and T16.
4.8
2.5
µs
µs
D
t
(N)
W
REC AFC pull-in range 1
∆f
Input a string of pulses (negative polarity) at
286 mV, 15.7 kHz with a width of 5 µs. After
increasing the frequency of the pulse string until
the waveform at pin 20 is disrupted, then reduce
the frequency until the waveform at pin 20 is
+1.0
+7.0
kHz
AFC1
normal again; that pulse string frequency is f
1
∆f
= f – 15.734 (kHz)
1
AFC1
Continued on next page.
No.5472 - 6/13

 SANYO [ SANYO SEMICON DEVICE ]